|
| It does not matter how slowly you go as long as you do not stop |
Fronius
go 2 top
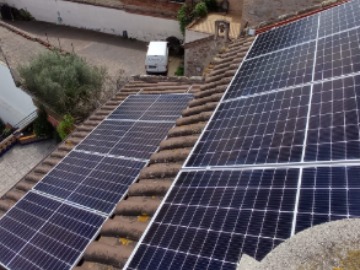
Sa meua instalacio solar
L'Abril de 2022 me la fan la gent de Nou6tema
8.892 + 1.867 (21 % IVA) = 10.760 € -> pressupost
Plaques
20220419 : porten 14 plaques
Risen RSM144-7-450M de 450 Wp = 6,3 kWp / 19,29 m2 :
- P(max) = 450 W
- V(Pmax) = 41,30 V
- I(Pmax) = 10,90 A
- V(oc) = 49,70 V
- I(sc) = 11,50 A
- 144 cell Monocrystaline PERC module : 6 x 12 + 6 x 12
- cell size : 166 x 83 mm = 13.778 mm2 = 1,38 m2
- 20,6 % maximum efficiency
- pes : 24,5 Kg
- dimensions : 2108 x 1048 x 35 mm
Inversor
inversor Fronius Primo 5.0-1 :
specs
- number of MPP trackers = 2
- MPP voltage range (Umpp min - Umpp max) = 240 - 800 V
- usable MPP voltage range = 80 - 800 V
- number of DC connections = 2 + 2
- max. PV generator power (Pdc max) = 7,5 kW peak
- AC nominal output (Pac,r) = 5.000 W
- el inversor genera un nivel de potencia acústica máximo de < 65 dB
- inclou DataManager "101" -
versio firmware 3.26.1-3 : use Solar Web -> Settings -> Components
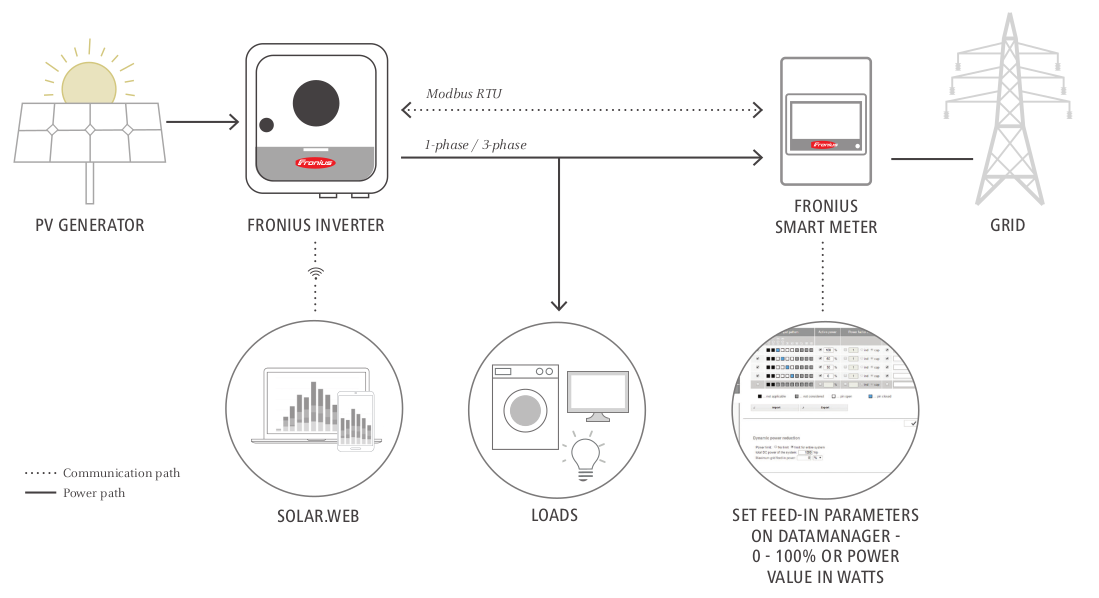
A través de la conexión a Internet mediante LAN o WLAN,
el Fronius "Datamanager" transmite los valores de la instalación fotovoltaica directamente al portal online Fronius Solar.web
para proporcionar en todo momento una vista general sobre el funcionamiento de la instalación.
- Smart Meter : Smart Meter 63A-1, Feed-in point (Primary meter), SN 21470645
The Fronius "Smart Meter" monitors the energy flow in from and out to the grid and is linked via a data cable to your inverter's data manager card which compiles the information.
Meter_Location_Current 0...grid interconnection point (primary meter)
- Part number : 4,210,063
- 2x sn [/]
- LAN MAC = 00:03:AC:40:DB:74
- WLAN MAC address = 6C:1D:EB:F7:FA:A5
- IP = 192.168.1.29 {fixed, 2022.08.01} -> 192.168.1.229 {2026}
nicolau@mars:~$ ping fronius + arp -a
fronius (192.168.1.29) at 6c:1d:eb:f7:fa:a5 [ether] on wlp3s0
- WLAN SSID : "a22" - Fronius Datamanager card is not compatible with 5 GHz Wi-Fi networks
- network diagnostics : ping solarweb.fronius.com (213.33.117.249)
- garantia :
Ya disfrutas de una protección de garantía gratuita para tu Fronius Primo 5.0-1 (número de serie: 33193718).
Esto te proporciona una garantía completa para tu producto Fronius hasta el 18.04.2029.
- proteccio : IP65, IP67. Amb IP65 suficient, IP67 vol dir summergir l'equip dins l'aigua
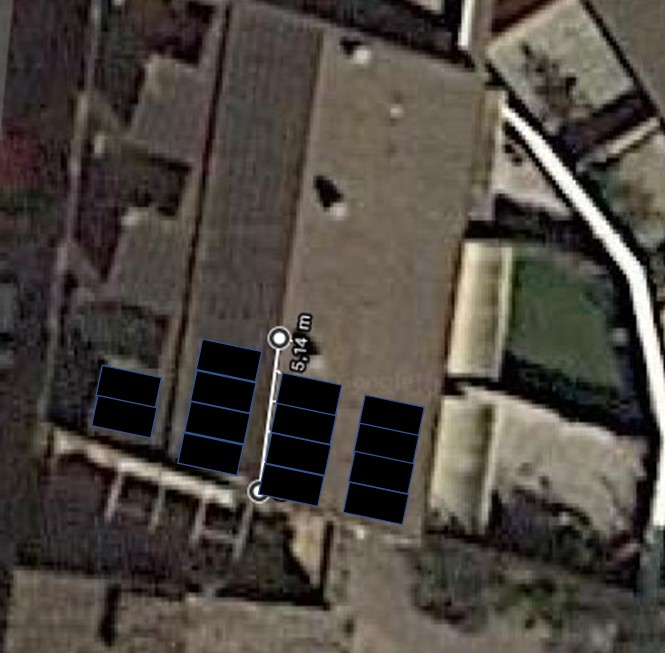
- strings : fem 2 strings - un de 8 plaques (mirant al Est), un de 6 plaques (mirant al Oest)
A series-connected set of solar cells or modules is called a "string".
MPPT = Maximum Power Point Tracking
The Power Point Tracker is a high-frequency DC to DC converter.
They take the DC input from the solar panels,
change it to high-frequency AC,
and convert it back down to a different DC voltage and current to exactly match the panels to the batteries.
theory and operation of "Maximum Power Point Tracking"
Smart Meter
Suport de Fronius
Manuals de Fronius
xifres de consum, preus i factures
Dates importants :
- Abril 2022 : posem plaques solars amb Nou6tema
- Abril de 2023 : passem Torrelles a BonPreu-Esclat
contractes amb Energia XXI
Energia XX1 - u(ss), p(E-vin-19)
Numero de contrato Lloc Tipus Potencia contratada Numero de contrato (*)
. . . . .
130063600447 Maritim 43 TUR EEXXI EN SVE 2.0 TD 3,3 kW .
040032880871 Marti Mas 3 TUR EEXXI EN SVE 2.0 TD 6,9 kW E00070800197582600040001
factures de Energia XXI
Energia XX1 - u(ss), p(Ev19)
Es interessant "Mi Consumo" -> "Escollir periode" + "Vista por factura" -> "Guardar com full de calcul" + format CSV
Hi ha els preus per hora (*** excepte la darrera factura ***)
. -- Any 2023 --. . -- Any 2022 --. . -- Any 2021 --. . -- Any 2020 --. .-- Any 2019 --.
€ kWh € kWh € kWh € kWh € kWh
gener 189,21 738 (9) 925,79 2.585 273,30 2.443 216,63
febrer 201,58 802 (10) 824,87 2.478 363,15 2.426 316,28 118,33
març 174,53 742 (11) 563,00 1.704 170,20 1.765 196,21 275,17
abril 60,60 340 (12) 650,03 1.457 197,99 1.456 144,47 83,82
maig 11,99 55 (13) 162,34 455 (1) 123,53 601 98,63 99,93
juny . . 58,21 108 (2) 105,10 486 57,46 * 475 75,96
juliol . . 62,19 78 (3*) 94,31 389 59,90 462 58,72
agost . . 28,15 70 (4) 103,82 396 67,48 486 72,61
setembre . . 39,38+8 101 (5) 111,47 397 56,80 384 63,20
octubre . . 10,54 71 (6) 121,11 383 60,32 389 64,06
novembre . . 18,64 132 (7) 150,40 434 100,26 634 83,22
desembre . . 55,78 262 (8) 454,53 1.509 89,38 687 195,38
. . 3.244,70 . 2.268,91 12.685 1.406,36 1.190,40
Fecha cargo Periodo de consumo Consumo acumulado del último año
(1) 12 de Mayo 02 de Abril de 2022 a 30 de Abril de 2022 13.274 kWh
(2) 10 de Junio 30 de Abril de 2022 a 30 de Mayo de 2022 12.323 kWh
(3) 7 de Julio 30 de Mayo de 2022 a 27 de Junio de 2022 12.367 kWh
(*) 27 de Juny a 30 de Juny (72+5,93 kWh 59,46+2,73 €)
(4) 26 de Agost 30 de Juny a 31 de Juliol 12.052 kWh
(5) 28 de Novembre 31 de Juliol a 31 de Agost de 2022 11.757 kWh
(6) 7 de Desembre 9 de Setembre a 30 de Setembre 11.476 kWn
(7) 9 de Desembre 30 de Setembre a 31 de Octubre 10.772 kWh
(8) 26 de Desembre 31 de Octubre a 30 de Novembre 9.525 kWh
(9) 19 Gener 2023 30 Nov - 31 Des 10.263 kWh
(10) 13 de Febrer 2023 31 Des - 31 Gener 6.002 kWh
(11) 24 de Abril 2023 31 Gener - 28 Febrer 6.744 kWh
(12) 26 de Abril 2023 28 Febrer - 31 Març 5.380 kWh
(13) 2 de Maig de 2023 31 Març - 18 Abril 3.978 kWh
See nicolau@mars:~/sebas/endesa/factures_per_anys/1_factures_tot_2019-2022.ods
See balanç energetic del dia
See 2021
20230414 : passem a *** Bonpreu Esclat ***
Resums de les factures
Quadre al principi de la factura, sense impostos
emitida periodo Potencia contratada Energía consumida Energía excedentaria Total factura
21/nov/2022 31/7/22 a 31/8/22 23,77 € 44,50 € -41,31 € 39,38 €
7/des/2022 9/9/22 a 30/9/22 8,25 € 23,64 € -21,92 € 10,54 €
9/des/2022 30/9/22 a 31/10/22 12,17 € 32,89 € -27,44 € 18,64 €
26/des/2022 31/10/22 a 30/11/22 11,78 € 50,31 € -9,23 € 55,78 €
12/gen/2023 30/11/22 a 31/12/22 12,17 € 168,44 € -1,31 € 189,21 €
ENDESA - preu de la potencia
data factura potencia contractada factura P1 factura P3 Total
28/11/22 9,2/9,2 9,2 * 26,164043 * (31/365) 9,2 * 1,143142 * (31/365) 23,77 € {20.44+0,89}
7/12/22 4,8/2,4 4,8 * 26,164043 * (21/365) 2,4 * 1,143132 * (21/365) 8,25 € {per 31 dies : 10,89}
Veure els meus
canvis de potencia amb Energia XXI
SAG calcula la factura
Ho podem fer en batch, on demand, mitjançant
- les dades de potencia gravades cada minut
# PKW - guardar en CSV la energia del darrer minut, produida, consumida i la entrada/sortida de la xarxa
*/1 * * * * /home/pi/python/pkw/eines/veure_potencia_instant/4_veure_potencia_instant_i_esciure_a_fitxer.py
out : /home/pi/python/pkw/dades/potencies/csv/, as pot_CSV_2022_09_04.csv, contenint :
szTemps, p_pv, p_load, p_grid {timestamp, produccio, consum, compra/venda}
18:44,1086,-285,-800
18:45,1046,-280,-765
18:46,1029,-297,-731
- el preu de la energia que compro cada hora es grava cada nit
# PKW - llegir preus de REE a les 22 h i 0 minuts : PVPC = jo compro
00 22 * * * /home/pi/python/pkw/eines/ree/1_get_preu_pvpc.sh
out : /home/pi/python/pkw/dades/ree/pvpc/preu_PVPC_Y2022-M07-D29.json
- el preu de la energia que venc cada hora es grava cada nit
# PKW - llegir preus de REE a les 22 h i 5 minuts : PCEX = jo venc
05 22 * * * /home/pi/python/pkw/eines/ree/2_get_preu_excedente.sh
out : /home/pi/python/pkw/dades/ree/pcex/preu_PCEX_Y2022-M07-D29.json
en cas de errors
Podem llegir un preu "vell" (fent servir un "token") mitjançant : PVPC = jo compro, PCEX = jo venc
pi@R4:~/python/pkw/eines/ree $ ./4_curl_get_old_pvpc.sh 29-07-2022 Y2022-M07-D29
ree_URL='https://api.esios.ree.es/indicators/1001?vis=1&start_date='$p1'T00%3A00&end_date='$p1'T23%3A00&groupby=hour&geoids=8741'
FQFN = (/home/pi/python/pkw/dades/ree/pvpc/preu_PVPC_Y2022-M07-D29.json).
pi@R4:~/python/pkw/eines/ree $ ./5_curl_get_old_pcex.sh 29-07-2022 Y2022-M07-D29
ree_URL='https://api.esios.ree.es/indicators/1739?vis=1&start_date='$p1'T00%3A00&end_date='$p1'T23%3A00&groupby=hour&geoids=8741'
FQFN = (/home/pi/python/pkw/dades/ree/pcex/preu_PCEX_Y2022-M07-D29.json).
Tenim una eina per
comprovar que el token funciona, que no ha caducat
Es el que sembla dir la seva pagina - que caduquen
un cas real - Agost 2022
30 de juny a 31 de Juliol -
see detalls factura Agost 2022
o pdf
A la factura hi trobem (ells fan una lectura cada 15 minuts, cuartorario) :
Costes de la energía ... 23,57 €
Otros conceptos ... -23,16 €
Compensación excedente Punta (208,291 kWh x 0,147324 Eur/kWh) ............ -30,69 €
Compensación excedente Llano (227,398 kWh x 0,146337 Eur/kWh) ............ -33,28 €
Compensación excedente Valle (230,484 kWh x 0,124212 Eur/kWh) ............ -28,63 €
Ajuste para límite de compensación (1) ..................................... 69,44 €
Faig jo el calcul
pi@R4:~/python/pkw/eines/factura $ ./1_factura.py "2022/06/30 00:00:00" "2022/07/31 23:59:59"
+++ En el periode {2022/06/30 00:00:00 .. 2022/07/31 23:59:59} - (46080/46080) minuts ...
+++ (1) Energia produida (614720) Wh.
+++ (2) Energia consumida (312928) Wh.
+++ (3) Energia de autoconsum (128967) Wh.
+++ (4) Energia comprada (090781) Wh.
+++ (5) Energia venuda (392251) Wh.
*** (1) produida + (4) comprada == (2) consum + (5) venuda ***
*** in (705501) = out (705179)
Hem escrit 2 factures : a pagar i a cobrar
... (/home/pi/python/pkw/eines/factura/factures/factura_a_pagar_2022-09-06.csv)
... (/home/pi/python/pkw/eines/factura/factures/factura_a_cobrar_2022-09-06.csv).
Fecha i Hora , Compro a Red (kWh) , Precio (€/kWh) , Coste por hora (€)
--- --- --- --- --- 90.781867 . 30.98537226 .
Fecha i Hora , Venda a Red (kWh) , Precio (€/kWh) , Cobro por hora (€)
+++ +++ +++ +++ +++ 392.251200 . 53.49670778 .
53,50 - 31 = 22,50 € a cobrar {Endesa 23,16 €}
Energia produida i consumida cada dia
Per un altra banda, cada dia a les 22:55 {compte amb l'horari d'hivern}
guardem la energia que hem poduit i hem consumit en tot el dia:
{R4 crontab /home/pi/python/fronius/1_llegir_energia.py -> pi@R4:~/python/fronius/energies_per_dies.log}
Fa servir la crida
nicolau@mars:~/sebas/python/fronius$ cat ./7_power_flow_realtime_data.py
endpoint = "/solar_api/v1/GetPowerFlowRealtimeData.fcgi" # see
API
szDades = urllib.urlopen( my_url ).read().decode(encoding='UTF-8').strip()
objjson = json.loads( szDades )
energia_del_dia = objjson["Body"]["Data"]["Inverters"]["1"]["E_Day"] # AC Energy [Wh] this day
Els valors dels darrers periodes son :
- {/home/nicolau/sebas/energia_solar/fronius/dades/produccio_maig_2022_endavant.ods}
- {/home/nicolau/sebas/energia_solar/fronius/dades/sag_2023.ods}
pi@R4:~/python/fronius $ cat energies_per_dies.log { 22:55:01 - Wh }, also at minie: ./dades/energia_solar/fronius/dades/energies_per_dies.log
* data * energia produida *
=========================== --- 2022 *
* 01-Gener * 02-Febr * 03-Març * 04-Abril * 05-Maig * 06-Juny * 07-Jul * 08-Agost * 09-Set * 10-Oct * 11-Nov * 12-Des *
+++ 01 * . * . * . * . * . * 37610 * 19459 * 33740 * 29869 * 24416 * 14677 * 6765 *
+++ 02 * . * . * . * . * . * 34480 * 20538 * 33510 * 21084 * 24071 * 14460 * 8576 *
+++ 03 * . * . * . * . * . * 36250 * 18631 * 33910 * 19365 * 23079 * 7772 * 10475 *
+++ 04 * . * . * . * . * . * 34610 * 19527 * 33620 * 26693 * 22958 * 15807 * 4588 *
+++ 05 * . * . * . * . * . * 36790 * 19298 * 28770 * 17253 * 21628 * 14924 * 9569 *
+++ 06 * . * . * . * . * 35440 * 37450 * 10734 * 33500 * 28101 * 17096 * 15143 * 7678 *
+++ 07 * . * . * . * . * 32380 * 36900 * 35440 * 30500 * 24465 * 1319 * 13369 * 6652 *
+++ 08 * . * . * . * . * 29601 * 26894 * 37380 * 32696 * 16986 * 15373 * 9870 * 2733 *
+++ 09 * . * . * . * . * 34800 * 31021 * 37240 * 31652 * 17833 * 15890 * 9243 * 9706 *
+++ 10 * . * . * . * . * 35980 * 37460 * 36940 * 32820 * 26265 * 13001 * 11507 * 7189 *
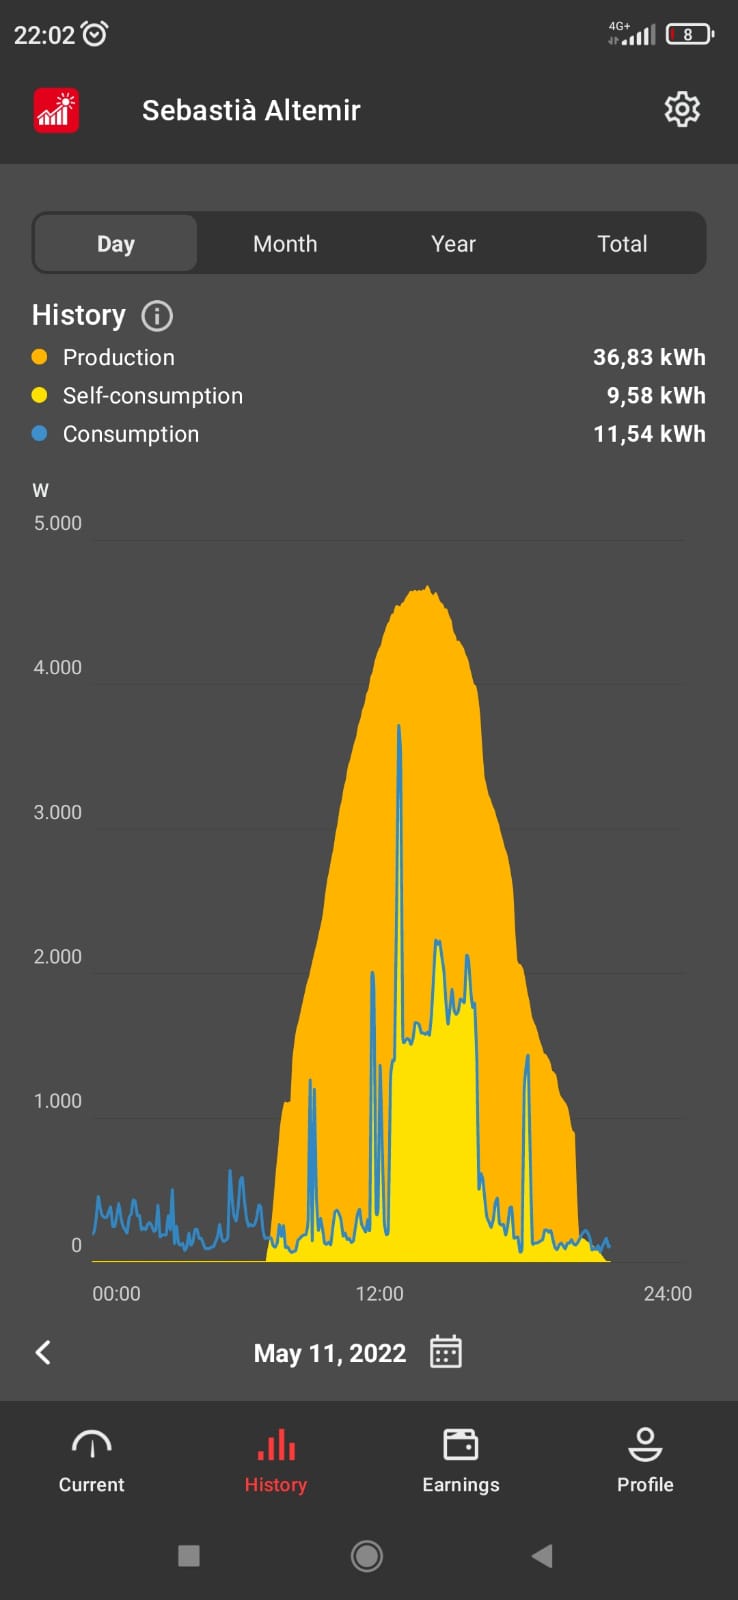
+++ 11 * . * . * . * . * 36830 * 37130 * 36560 * 32668 * 19172 * 10276 * 11731 * 4127 *
+++ 12 * . * . * . * . * 36580 * 35100 * 36310 * 31286 * 23490 * 20144 * 10236 * 4203 *
+++ 13 * . * . * . * . * 35690 * 35250 * 36290 * 27046 * 13624 * 18263 * 12864 * 3477 *
+++ 14 * . * . * . * . * 35170 * 29558 * 36060 * 27241 * 9465 * 20360 * 10614 * 9383 *
+++ 15 * . * . * . * . * 34890 * 32820 * 34990 * 31846 * 24907 * 19293 * 7408 * 8493 *
+++ 16 * . * . * . * . * 35140 * 34253 * 34610 * 19985 * 21581 * 13871 * 10742 * 8296 *
+++ 17 * . * . * . * . * 36090 * 35150 * 34690 * 20654 * 20289 * 9807 * 7040 * 3176 *
+++ 18 * . * . * . * . * 34880 * 34490 * 34230 * 19451 * 26282 * 13842 * 7672 * 9434 *
+++ 19 * . * . * . * . * 33720 * 34860 * 34610 * 33070 * 25206 * 12071 * 12584 * 6953 *
+++ 20 * . * . * . * . * 34900 * 31205 * 32604 * 32424 * 20919 * 7200 * 12709 * 7743 *
+++ 21 * . * . * . * . * 35070 * 19219 * 34130 * 26127 * 23582 * 14503 * 3457 * 8592 *
+++ 22 * . * . * . * . * 35390 * 28135 * 34680 * 22997 * 22067 * 13260 * 8286 * 8634 *
+++ 23 * . * . * . * . * 35710 * 35340 * 29251 * 30968 * 18974 * 8813 * 8145 * 9398 *
+++ 24 * . * . * . * . * 8972 * 30310 * 34270 * 30776 * 12958 * 13601 * 6694 * 9279 *
+++ 25 * . * . * . * . * 14500 * 21318 * 23040 * 28205 * 18955 * 15944 * 8623 * 9671 *
+++ 26 * . * . * . * . * 38070 * 11742 * 29750 * 29059 * 20826 * 14467 * 10182 * 8370 *
+++ 27 * . * . * . * . * 29304 * 10679 * 22400 * 24090 * 20668 * 14302 * 10039 * 9375 *
+++ 28 * . * . * . * . * 36770 * 18873 * 16916 * 28825 * 16800 * 15810 * 4595 * 9657 *
+++ 29 * . * . * . * . * 36090 * 20825 * 17626 * 22721 * 16647 * 14361 * 10643 * 7547 *
+++ 30 * . * . * . * . * 36790 * 19328 * 22601 * 27784 * 20751 * 12077 * 6503 * 6572 *
+++ 31 * . * . * . * . * 37420 * . * 33940 * 13640 * . * 10973 * . * 9492 *
mensual . * . * . * . * 866.177 905.050 904.745 885.581 625.077 472.069 307.539 235.803 .
acumulat . * . * . * . * 866.177 1.771.227 2.675.972 3.561.553 4.186.630 4.658.699 4.966.238 5.202.041 .
* +++ 2023 --- 2023 *
* 01-Gener * 02-Feb * 03-Mar * 04-Abr * 05-Maig * 06-Juny * 07-Jul * 08-Agost * 09-Set * 10-Oct * 11-Nov * 12-Des *
+++ 01 * 7311 * 14624 * 23600 * 21901 * 29407 * 25801 * 35590 * 32097 * 25366 * 21995 * 12692 * 6215 *
+++ 02 * 7211 * 15165 * 14888 * 28410 * 33580 * 32920 * 31237 * 32765 * 11351 * 19887 * 7304 * 10368 *
+++ 03 * 6026 * 15185 * 23066 * 31103 * 35320 * 23011 * 29102 * 15831 * 16677 * 18277 * 14650 * 9626 *
+++ 04 * 9885 * 15541 * 23217 * 28953 * 33270 * 31291 * 18746 * 28849 * 24234 * 20868 * 9134 * 7459 *
+++ 05 * 10138 * 15775 * 23851 * 31494 * 33300 * 33900 * 13522 * 34580 * 25423 * 11509 * 15252 * 9452 *
+++ 06 * 10369 * 9326 * 17811 * 26904 * 22981 * 34500 * 30339 * 15627 * 25992 * 20325 * 15160 * 9466 *
+++ 07 * 10128 * 1706 * 21677 * 31095 * 23491 * 23754 * 27184 * 26326 * 28959 * 17199 * 15269 * 9062 *
+++ 08 * 4757 * 8867 * 20433 * 31887 * 30819 * 32850 * 35310 * 24122 * 28441 * 20978 * 14433 * 7995 *
+++ 09 * 10929 * 11258 * 10614 * 29316 * 28235 * 27179 * 33630 * 28562 * 28251 * 20247 * 5493 * 8722 *
+++ 10 * 10327 * 14250 * 24094 * 26821 * 36640 * 35350 * 33620 * 27509 * 26611 * 20480 * 13065 * 9224 *
+++ 11 * 7848 * 17709 * 15491 * 29076 * 25676 * 29059 * 31163 * 31974 * 24567 * 20505 * 9161 * 8612 *
+++ 12 * 10377 * 18085 * 24689 * 29874 * 14944 * 35130 * 29518 * 31462 * 19279 * 19932 * 9882 * 4813 *
+++ 13 * 8885 * 17974 * 22645 * 33080 * 23494 * 19099 * 32073 * 30926 * 22840 * 18071 * 12523 * 4189 *
+++ 14 * 11156 * 17570 * 25923 * 26369 * 30827 * 28907 * 31880 * 30166 * 23299 * 15379 * 12047 * 9683 *
+++ 15 * 8767 * 17511 * 25632 * 30476 * 30288 * 34160 * 31585 * 30892 * 6681 * 5713 * 10143 * 9458 *
+++ 16 * 10107 * 10728 * 26363 * 31786 * 32246 * 25350 * 31638 * 17975 * 22120 * 6302 * 9936 * 7494 *
+++ 17 * 10357 * 18886 * 13861 * 31448 * 37460 * 18992 * 31697 * 29580 * 20482 * 12825 * 11144 * 9429 *
+++ 18 * 10980 * 18999 * 15532 * 24315 * 26474 * 14594 * 33590 * 27815 * 23944 * 17330 * 10969 * 9436 *
+++ 19 * 12506 * 18652 * 23664 * 33210 * 18766 * 20860 * 31772 * 25612 * 15448 * 12451 * 12036 * 9348 *
+++ 20 * 10784 * 19271 * 27246 * 32175 * 29575 * * 30991 * 28704 * 12803 * 17424 * 10539 * 6772 *
+++ 21 * 13253 * 15235 * 24278 * 20550 * 30259 * * 25515 * 28980 * 20374 * 17928 * 10007 * 8679 *
+++ 22 * 12040 * 16304 * 27064 * 28545 * 17433 * 30839 * 29113 * 29197 * 26054 * 12714 * 11948 * 9386 *
+++ 23 * 13767 * 4707 * 27125 * 28073 * 30030 * 34770 * 32584 * 28434 * 25264 * 12156 * 11856 * 9379 *
+++ 24 * 5413 * 20853 * 20661 * 30596 * 31515 * 31885 * 22566 * 28647 * 23455 * 18227 * 10828 * 9377 *
+++ 25 * 12996 * 11169 * 27705 * 30773 * 6140 * 35420 * 34050 * 27657 * 22235 * 14434 * 7480 * 9553 *
+++ 26 * 13563 * 12188 * 26030 * 30602 * 34090 * 34230 * 24765 * 13388 * 25061 * 10145 * 7508 * 9501 *
+++ 27 * 11083 * 14607 * 29473 * 29525 * 35880 * 31067 * 15395 * 3836 * 24017 * 14769 * 7212 * 9689 *
+++ 28 * 8711 * 13710 * 24851 * 30576 * 34680 * 27150 * 33800 * 27683 * 22852 * 16597 * 8789 * 6960 *
+++ 29 * 13369 * * 29835 * 30124 * 32695 * 26642 * 32009 * 31062 * 22949 * 14261 * 3499 * 6469 *
+++ 30 * 14851 * * 27345 * 26972 * 31055 * 24861 * 30221 * 21091 * 23215 * 11338 * 9664 * 8993 *
+++ 31 * 14742 * * 24141 * * 27010 * * 22125 * 30019 * * 14276 * * 7704 *
mensual 322.636 405.855 712.805 876.029 887.580 803.571 906.330 821.368 668.244 494.542 319.623 262.513 *
acumulat 322.636 728.491 1.441.296 2.317.325 3.204.905 4.008.476 4.914.806 5.736.174 6.404.418 6.898.960 7.218.583 7.481.096 *
* +++ 2024 --- 2024 *
* 01-Gener * 02-Feb * 03-Mar * 04-Abr * 05-Maig * 06-Juny * 07-Jul * 08-Agost * 09-Set * 10-Oct * 11-Nov * 12-Des *
+++ 01 * 6494 * 13727 * 21886 * 27838 * 24469 * 26616 * 10359 * 30373 * 14943 * 19216 * 9211 * 3975 *
+++ 02 * 6756 * 11414 * 16529 * 27349 * 35300 * 29930 * 33580 * 29040 * 25669 * 11288 * 2082 * 8235 *
+++ 03 * 3392 * 13309 * 14083 * 26722 * 33840 * 33870 * 27678 * 31923 * 5796 * 18578 * 2294 * 9319 *
+++ 04 * 4359 * 14047 * 19220 * 28639 * 31708 * 34690 * 28548 * 30528 * 6446 * 19874 * 5769 * 9426 *
+++ 05 * 6477 * 14718 * 22942 * 23147 * 31507 * 35340 * 34350 * 29982 * 23810 * 21817 * 8522 * 9213 *
+++ 06 * 10311 * 10899 * 23087 * 26131 * 22298 * 33870 * 28443 * 29910 * 10267 * 16313 * 10186 * 6691 *
+++ 07 * 10580 * 14447 * 14683 * 14824 * 32015 * 33030 * 21647 * 29552 * 22510 * 11202 * 7943 * 6631 *
+++ 08 * 10695 * 13506 * 18630 * 17766 * 34320 * 23331 * 32224 * 30290 * 10291 * 20130 * 11122 * 9627 *
+++ 09 * 10030 * 6680 * 2754 * 24698 * 34960 * 17282 * 32732 * 30189 * 27622 * 16910 * 10722 * 10105 *
+++ 10 * 1900 * 9489 * 17210 * 31198 * 34390 * 8677 * 33420 * 29994 * 16467 * 17529 * 12807 * 4466 *
+++ 11 * 8389 * 16598 * 24858 * 30304 * 34580 * 8080 * 32950 * 29835 * 19473 * 9417 * 12743 * 3560 *
+++ 12 * 10544 * 14227 * 20133 * 29457 * 25740 * 29213 * 25895 * 30331 * 12729 * 6524 * 7124 * 1708 *
+++ 13 * 10625 * 13184 * 24777 * 29812 * 31120 * 36790 * 22916 * 21384 * 27303 * 16987 * 1990 * 6251 *
+++ 14 * 7175 * 16128 * 24947 * 30141 * 12572 * 28165 * 31605 * 21141 * 27611 * 10584 * 11237 * 8457 *
+++ 15 * 6986 * 12847 * 20762 * 22311 * 13565 * 30272 * 30131 * 20113 * 26892 * 3984 * 7011 * 9253 *
+++ 16 * 5842 * 5518 * 23673 * 30699 * 15865 * 35310 * 28555 * 21284 * 25333 * 13110 * 9007 * 9286 *
+++ 17 * 8179 * 14701 * 23399 * 29234 * 24171 * 33480 * 33020 * 27936 * 20010 * 10917 * 10926 * 9098 *
+++ 18 * 11061 * 16958 * 23646 * 23986 * 21911 * 34840 * 32920 * 15977 * 11461 * 12926 * 6022 * 8462 *
+++ 19 * 1378 * 13716 * 21214 * 32377 * 25900 * 27161 * 30670 * 26747 * 16166 * 17963 * 10651 * 7234 *
+++ 20 * 11520 * 17199 * 20651 * 31599 * 23074 * 12100 * 31875 * 28239 * 7914 * 17474 * 6033 * 9265 *
+++ 21 * 9076 * 16385 * 22508 * 18869 * 30683 * 32606 * 26859 * 23688 * 3503 * 16087 * 5004 * 9199 *
+++ 22 * 11780 * 13724 * 24194 * 20028 * 22469 * 32840 * 33370 * 24049 * 9296 * 11016 * 11048 * 7823 *
+++ 23 * 11675 * 19023 * 21468 * 26767 * 29737 * 20671 * 32677 * 26842 * 15065 * 16613 * 10065 * 9186 *
+++ 24 * 11794 * 16946 * 10831 * 33970 * 27539 * 22289 * 32530 * 26866 * 18958 * 16018 * 8616 * 6615 *
+++ 25 * 12111 * 10377 * 4539 * 10410 * 29812 * 33080 * 32074 * 20687 * 21882 * 7420 * 4332 * 5668 *
+++ 26 * 12118 * 14515 * 8716 * 32076 * 35230 * 31918 * 31408 * 21267 * 22818 * 3346 * 6798 * 2947 *
+++ 27 * 11777 * 17698 * 22988 * 10022 * 26675 * 28966 * 31758 * 19739 * 24262 * 7074 * 9184 * 9127 *
+++ 28 * 9611 * 12714 * 26036 * 7228 * 34360 * 29496 * 30331 * 25138 * 23980 * 2404 * 10323 * 9216 *
+++ 29 * 3368 * 21055 * 22980 * 2281 * 33310 * 19952 * 30751 * 25319 * 23455 * 7644 * 10204 * 9325 *
+++ 30 * 7228 * * 20426 * 15173 * 36020 * 19348 * 26869 * 25288 * 18395 * 570 * 7637 * 9302 *
+++ 31 * 13263 * * 10522 * * 33450 * * 30564 * 22968 * * 6370 * * 9335 *
mensual 266.494 405.749 594.292 715.056 882.590 823.213 922.709 806.619 540.327 387.305 246.613 238.005 *
acumulat 266.494 672.243 1.266.535 1.981.591 2.864.181 3.687.394 4.610.103 5.416.722 5.957.049 6.344.354 6.590.967 6.828.972 *
* +++ 2025 --- 2025 *
* 01-Gener * 02-Feb * 03-Mar * 04-Abr * 05-Maig * 06-Juny * 07-Jul * 08-Agost * 09-Set * 10-Oct * 11-Nov * 12-Des *
+++ 01 * 7458 * 4176 * 18397 * 27676 * 20835
+++ 02 * 9433 * 13601 * 6142 * 3148 * 15848
+++ 03 * 6750 * 14156 * 2415 * 17437 * 27085
+++ 04 * 8705 * 14292 * 18619 * 19790 * 24281
+++ 05 * 8050 * 14498 * 20346 * 20629 * 22859
+++ 06 * 7322 * 14099 * 3717 * 26042 * 19886
+++ 07 * 10022 * 8140 * 2176 * 27786 * 31911
+++ 08 * 9426 * 11012 * 4560 * 27363 * 32711
+++ 09 * 9765 * 11847 * 10221 * 26018 * 20268
+++ 10 * 8985 * 5984 * 14009 * 18166 * 19036
+++ 11 * 6705 * 9851 * 10268 * 25202 * 26796
+++ 12 * 10803 * 2132 * 9322 * 17730 * 27711
+++ 13 * 10584 * 12741 * 10705 * 18748 *
+++ 14 * 10896 * 15185 * 5770 * 16847 *
+++ 15 * 10707 * 5780 * 19189 * 19809 *
+++ 16 * 10221 * 11308 * 14256 * 18310 *
+++ 17 * 10881 * 16268 * 18128 * 30728 *
+++ 18 * 9714 * 6268 * 13386 * 28646 *
+++ 19 * 7750 * 7386 * 856 * 17347 *
+++ 20 * 6127 * 4310 * 1408 * 30804 *
+++ 21 * 6409 * 2062 * 2880 * 27819 *
+++ 22 * 10834 * 3764 * 16755 * 27889 *
+++ 23 * 10271 * 7039 * 7240 * 24322 *
+++ 24 * 12259 * 15019 * 17708 * 29861 *
+++ 25 * 10182 * 7290 * 17573 * 21519 *
+++ 26 * 10817 * 20366 * 20838 * 10036 *
+++ 27 * 6548 * 17737 * 19112 * 26416 *
+++ 28 * 12316 * 17675 * 23279 * 10580 *
+++ 29 * 11666 * * 27540 * 31804 *
+++ 30 * 13338 * * 27659 * 31551 *
+++ 31 * 11624 * * 27336 * *
mensual .
acumulat .
Aquest valor coincideix perfectament amb la lectura que dona la APP
i que guardem aqui 
Si ens falta algun dia, podem
llegir des Archive
Per fer grafiques, llegim les dades del R4 al Minie amb
sebas@minie:~/dades/energia_solar/fronius/dades$ scp pi@r4:/home/pi/python/fronius/energies_per_dies.log .
Les acumulacions les fem amb "LibreOffice Calc" al fitxer "/home/sebas/dades/energia_solar/fronius/dades/sag_2024.ods" del Minie
Per importar, fem
- copiar de la pagina web
- aquí picar boto dret en una casella
- Paste especial -> Paste especial -> Use text import dialog
- delimiter := "*"
See Fronius APIs
Mira grafiques a Gugel SpreadSheets
Events amb el Fronius
Events :
- 20220624 - MPP2 deix de produir - del 25.06.2022 fins 06.07.2022
- 20241025 - se'n va la llum fins 20241026 12h
Monitoritzem l'energia produida cada dia
Finalment, comptem la energia produida en 1 dia
- a partir de les mostres q agafem cada 5 segons.
{ cron /pkw/eines/analitzar_un_dia/energia_1_dia.py -> /pkw/logs/energia_pkw.log }
- de la API : GetPowerFlowRealtimeData.fcgi -> ["Body"]["Data"]["Inverters"]["1"]["E_Day"]
{ cron /pkw/eines/llegir_energia_generada_avui/8_llegir_energia_generada_avui.py -> /pkw/logs/energia_api.log }
- from "archive", see above
Ho fem 2 cops xq hi ha una petita discrepancia i vull saber-ne la rao
Monitoritzem l'energia consumida cada dia
eMail Fronius !
Calculs de energia diaria
Solar web ens diu per cada dia
- energia produida
- energia consumida
- energia autoconsum
Aquestes dades les treu del "archive" i ens en limita el accés a 3 dies ...
Naltros tenim /home/pi/python/pkw/dades/potencies/csv/, as pot_CSV_2022_09_04.csv - energia produida, consumida i diferencia (no es autoconsum)
Llavors (pi@R4:~/python/pkw/eines/analitzar_un_dia $ ./3_energies_1_dia_own_data.py 2022_10_13)
- sumem els 3 valors per tot el dia
- comprovem que hi hagi 1.440 linies :
1 mesura per minut, 60 mesures per hora, 1440 mesures per dia
Rendiment
Tenim instalades 14 plaques de 450 Wp = 6.300 Wp
A ple rendiment, podrien produir 151.200 Wh en un dia
En un any hem produit (sols produccio) ... 7.684.243 Wh
Aixo son 21.053 Wh/dia de mitjana per dia
Aixi el rendiment es de 21.053/151.200 = 14 %
Acces a ESIOS
Acces a ESIOS des python
sebas@minie:~/dades/python/llegir_preu_electre/agafem_altres_dades_de_REE$ cat gpt.py
#!/usr/bin/python3
# -*- coding: UTF-8 -*-
import requests
API_TOKEN = "22394404661c88c0111d33a255e366676777888a146999931c0000aca36aaadb"
hAcc="application/json; application/vnd.esios-api-v1+json"
hCon="application/json"
fecha = '2025-04-09'
INDICADOR_PVPC = 1001 # Precio medio nacional
INDICADOR_PCEX = 1739 # precio excedentes
miINDICADOR = INDICADOR_PCEX # escollim que volem llegir
url = f"https://api.esios.ree.es/indicators/{miINDICADOR}"
print('>>> URL {}'.format(url)) # https://api.esios.ree.es/indicators/1001?start_date=2025-04-10T00:00:00Z&end_date=2025-04-10T23:59:59Z
headers = {
"Accept": hAcc,
"Content-Type": hCon,
"x-api-key": API_TOKEN
}
print('>>> Headers {}'.format(headers)) #
print('>>> accedir al indicador {}'.format(miINDICADOR))
response = requests.get(url, headers=headers)
if response.status_code == 200:
print("+++ ok, RC is 200.")
# data = response.json()
# valores = data["indicator"]["values"]
# for valor in valores:
# hora = valor["datetime"]
# precio = valor["value"]
# print("+++ OK")
# print(f"{hora}: {precio} €/MWh")
json_data = json.loads(response.text) # parse a JSON string and convert into a dictionary
json_string = json.dumps(json_data, indent=4) # convert to a string
# print ( '+++ JSON [%s].' % json_string )
print ( '+++ JSON name is [%s].' % json_data["indicator"]["name"] )
else:
print("--- Error: response RC is ", response.status_code, response.text)
Acces a ESIOS des bash amb cURL
sebas@minie:~/dades/python/llegir_preu_electre/agafem_altres_dades_de_REE$ cat curl_OK.sh
#!/bin/bash
api_token="887b5568056e8337c44a111b588845553233f298ef486c57c758d879e9295959"
fecha="2025-04-09"
ptr="1001"
ptr="1739" # compte : no li agrada "geo_ids[]"
myURL="https://api.esios.ree.es/indicators/${ptr}?start_date=${fecha}T00:00:00Z&end_date=${fecha}T23:59:59Z&geo_ids[]=8741"
myHaccept="application/json; application/vnd.esios-api-v1+json"
myHcontent="application/json"
curl -s -X GET ${myURL} \
--header "Accept: ${myHaccept}" \
--header "Content-Type: ${myHcontent}" \
--header "x-api-key: ${api_token}"
rc=$?
echo '>>> CURL rc is ('$rc').'
Acces a ESIOS des bash amb wGet
sebas@minie:~/dades/python/llegir_preu_electre/agafem_altres_dades_de_REE$ cat 3_wget_OK.sh
#!/bin/bash
# get ESIOS data using WGET()
fecha="2025-04-08"
myOutFN="./myWGETout.txt"
api_token='e47b4e7809ee8457c63a1bcb5a4841943278f998ef288c57cf5fd374e1275155'
myHaccept="application/json; application/vnd.esios-api-v1+json" # v2 is also valid
myHcontent="application/json"
ptr="1001"
ptr="1739" # compte : no li agrada "geo_ids[]"
url="https://api.esios.ree.es/indicators/${ptr}?start_date=${fecha}T00:00:00Z&end_date=${fecha}T23:59:59Z&geo_ids[]=8741" #
echo '>>> wget URL is ('$url'), output('${myOutFN}').'
wget --quiet $url -O ${myOutFN} \ # el WGET() ha de anar sempre a fitxer
--header="Accept: ${myHaccept}" \
--header="Content-Type: ${myHcontent}" \
--header="x-api-key: ${api_token}" # also --header="x-api-key: \'${api_token}\'"
rc=$?
echo '>>> WGET rc is ('$rc').'
Prova minima i que funciona {2025.05.20} :
sebas@minie:~/dades/python/llegir_preu_electre/1001$ cat 1001_wget.sh
#!/bin/bash
url="https://api.esios.ree.es/indicators/1001"
wget $url
rv=$?
echo "+++ WGET rc is " $rv ",output is 1001 file."
4 Fronius API's
Open interfaces -
en,
es
- Fronius Solar API (JSON)
- Fronius "push" service
- Modbus TCP (se ejecuta en una capa física de Ethernet)
- Modbus RTU (protocolo de nivel serial)
API support
Fronius Solar Online Support - Solve your technical issues now.
Authentication - choose a company
An error occured. To find out more about the error, please copy the error code and contact the support.
8bfd7037-fb73-41ff-9f15-8279f77e31c5
fca1b61d-6e9a-4f3c-bb00-f0d98c698754
54df45e0-76b9-4c03-bf49-663a176b19a7
solar.sos
Solar.SOS can be used on your PC or, away from your desktop, on a tablet or smartphone.
The app is free and can be downloaded directly from the Play Store for Android.
El Fronius te una API que contesta JSON a un HTTP-GET
We provide an OpenAPI interface specification file for GEN24 inverters to support client generation in multiple languages.
Download the file here https://www.fronius.com/QR-link/0025 -> solarApiv1.zip -> solarApiv1.json
To display the spec you can use https://editor.swagger.io
For proper client generation please use https://openapi-generator.tech
Requests - currently, the only request protocol supported is HTTP : use HTTP-GET requests to query data from Solar API
There are 2 types of requests : realtime and archive
- Up to 2 realtime requests are allowed to be performed in parallel
with keeping a timeout of 4 seconds between two consecutive calls.
- Archive requests are not allowed to be performed in parallel
and need to keep a timeout of 120 seconds between two consecutive calls.
# 2.6 Timeout, 42,0410,2012_Fronius Solar API V1.pdf
List of most interesting requests :
- {global} /solar_api/GetAPIVersion.cgi
- {realtime} /solar_api/v1/GetActiveDeviceInfo.cgi?DeviceClass=System
- {realtime} /solar_api/v1/GetInverterRealtimeData.cgi?Scope=System
- {realtime} /solar_api/v1/GetSensorRealtimeData.cgi
- {realtime} /solar_api/v1/GetMeterRealtimeData.cgi?Scope=System
- {realtime} /solar_api/v1/GetStringRealtimeData.cgi
- {realtime} /solar_api/v1/GetPowerFlowRealtimeData.fcgi
- {archive} /solar_api/v1/GetArchiveData.cgi?Scope=System
Requests take many seconds to complete with the exception of /solar_api/v1/GetPowerFlowRealtimeData.fcgi, which only takes tens of milliseconds.
It seems this fast cgi was some afterthought second process?
All JSON structures are described using Orderly JSON, a textual format for describing JSON data.
Please refer to the online documentation on https://github.com/lloyd/orderly/ for details.
Acces a les parts de un JSON des python :
documentacio
Get API version sample
The response is like this ;
sebas@minie:~/dades/python/fronius/0_from_ARCHIVE$ ./0_test_api.sh
http://fronius/solar_api/GetAPIVersion.cgi
{
"APIVersion" : 1,
"BaseURL" : "/solar_api/v1/",
"CompatibilityRange" : "1.8-1"
}
Addressing of devices
A specific device is identified by the string parameter DeviceId.
To know what we have, we use /solar_api/v1/GetActiveDeviceInfo.cgi?DeviceClass=System :
nicolau@mars:~/sebas/python/fronius$ ./2_active_device_info.py
http://fronius/solar_api/v1/GetActiveDeviceInfo.cgi?DeviceClass=System
"Body": {
"Data": {
"Inverter": {
"1": {
"DT": 76,
"Serial": "33193718"
}
},
"Meter": {
"0": {
"DT": -1,
"Serial": "21470645"
}
},
"Ohmpilot": {},
"SensorCard": {}, --- no SensorCard -> no "GetSensorRealtimeData"
"Storage": {},
"StringControl": {} --- no StringControl -> no "GetStringRealtimeData"
}
},
realtime requests
(1) GetInverterRealtimeData
{realtime} /solar_api/v1/GetInverterRealtimeData.cgi
Aqui veiem la potencia que estem produint ara matex (identica a P_PV) i la energia que hem produit al llarg del dia
PAC {W}
DAY_ENERGY {Wh} Energy generated on current day
YEAR_ENERGY {Wh} Energy generated in current year
(2) GetSensorRealtimeData
(3) GetMeterRealtimeData
Here we can see the energy flow at my home entry point : (+ from grid , - to grid )
objjson["Body"]["Data"]["0"]["PowerReal_P_Sum"] {as P_Grid} -> lo que compro / venc ara mareix
Energy produced or consumed ?
The values EnergyReal_WAC_Sum_Produced and EnergyReal_WAC_Sum_Consumed represent the values for the Smart Meter itself.
The values EnergyReal_WAC_Minus_Absolute and EnergyReal_WAC_Plus_Absolute represent the values for Solar.web.
Now it depends where the Smart Meter is installed (Feed-In-Point or Consumption-Path),
so that either EnergyReal_WAC_Minus_Absolute is the same as EnergyReal_WAC_Sum_Produced or EnergyReal_WAC_Sum_Consumed.
See email
(4) GetPowerFlowRealtimeData
Please note, for performance reasons the URL extension is different to other Solar API requests.
It is better to use the fcgi call rather than the cgi call
because it returns less data and is much faster
because all the values are read from memory rather than flash storage
Aqui veiem el balanç entre energia produida i consumida
E_Day = AC Energy [Wh] this day # to be read at 23:45 every day and plot
E_Year = AC Energy [Wh] this year
E_Total = AC Energy [Wh] ever since
P_PV = lo que produeixo ( + production ( default ) ) # to be read every 5 seconds
P_Load = lo que gasto ( + generator , - consumer ) # to be read every 5 seconds
P_Grid = lo que venc / compro ( + from grid , - to grid ) # to be read every 5 seconds
Ho tenim :
- MARS : /home/nicolau/sebas/python/fronius/7_power_flow_realtime_data.py
- R4 : /home/pi/python/fronius/1_llegir_energia.py {crontab 23:55}
#!/usr/bin/env python
# -*- coding: UTF-8 -*-
# agafem dades del Fronius
import datetime # timestamp
import json
import sys
import urllib
hostname = "fronius" # defined in /etc/hosts
def main( argv ):
endpoint = "/solar_api/v1/GetPowerFlowRealtimeData.fcgi"
my_url = "http://" + hostname + endpoint
# print( "\n>>> (3) Read (%s)." % endpoint )
try:
szDades = urllib.urlopen( my_url ).read().decode(encoding='UTF-8').strip()
objjson = json.loads( szDades )
print( json.dumps( objjson, indent=4, sort_keys=True ) ) # display nice JSON ***
energia_del_dia = objjson["Body"]["Data"]["Inverters"]["1"]["E_Day"]
now = datetime.datetime.now()
szTime = now.strftime("%Y-%m-%d %H:%M:%S %Z")
print( "+++ {%s} todays energy = (%d) {Wh}." % (szTime, energia_del_dia ) )
except urllib.error.URLError as erroru:
print(erroru.reason)
if __name__ == "__main__":
main( sys.argv )
temps de resposta GetPowerFlowRealtimeData
De fet, es la duracio de la operacio "urllib2.urlopen(my_url).read()"
pi@pi0:~/njs/fronius $ ./2_ramon_mesura_temps.py
>>> (*) Read (/solar_api/v1/GetPowerFlowRealtimeData.fcgi).
Time difference is {58.303} milliseconds
pi@R4:~/python/pkw/eines/veure_potencia_instant $ ./2_ramon_mesura_temps.py
>>> (*) Read (/solar_api/v1/GetPowerFlowRealtimeData.fcgi).
Time difference is {32.126} milliseconds
(5) GetStringRealtimeData.cgi
RRG 20220704 :
no me'n surto d'aconseguir per JSON l'amperatge (o la potència, m'és igual) de cada string per separat.
http://fronius/solar_api/v1/GetStringRealtimeData.cgi?Scope=System&DeviceId=0&DataCollection=NowStringControlData
if we provide DeviceId, we shall use "Scope=Device"
Now we get
"Status": {
"Code": 12,
"Reason": "No StringControl with this index found.",
Lectura senzilla i acumulada :
get_example("/solar_api/v1/GetStringRealtimeData.cgi?Scope=System&DeviceId=0&DataCollection=NowStringControlData")
get_example("/solar_api/v1/GetStringRealtimeData.cgi?Scope=Device&DeviceId=1&DataCollection=CurrentSumStringControlData&TimePeriod=Day")
the most complete data reading using API
I think it's this one :
pi@R4:~/python/pkw/eines/veure_potencia_instant $ ./3_ramon.py
>>> (1) Read (/solar_api/v1/GetInverterRealtimeData.cgi?Scope=System).
+++ GetInverterRealtimeData PAC - (4191) {W}. As P_PV.
+++ GetInverterRealtimeData DAY_ENERGY - (12044) {Wh}. As E_Day.
>>> (2) Read (/solar_api/v1/GetMeterRealtimeData.cgi?Scope=System).
+++ real power [GetMeterRealtimeData PowerReal_P_Sum] - (-3670) {W}. As P_Grid.
>>> (3) Read (/solar_api/v1/GetPowerFlowRealtimeData.fcgi).
+++ todays energy (E_Day from Inverters) - (12044) {Wh}. As DAY_ENERGY.
+++ current power (P from Inverters) - (4191) {W}. As P_PV.
+++ GetPowerFlowRealtimeData P_PV - lo que produeixo - (4191).
+++ GetPowerFlowRealtimeData P_Load - lo que gasto ( + generator , - consumer ) - (-520).
+++ GetPowerFlowRealtimeData P_Grid - lo que compro / venc ( + from grid , - to grid ) - (-3670).
lets prepare to do it from Arduino
Minimal code :
sebas@minie:~/dades/python/fronius$ cat ard.sh
#!/bin/bash
hostname="fronius" # defined in /etc/hosts
endpoint="/solar_api/v1/GetPowerFlowRealtimeData.fcgi" #
my_url="http://"$hostname$endpoint # concatenate strings
echo $my_url
curl $my_url # outout to screen
exit 0
access it from Internet
We have a nodeJS server providing these values :
pi@pi0:~/.config/systemd/user $ cat fronius_nodejs.service
[Service]
Type=simple
WorkingDirectory=/home/pi/njs/fronius
ExecStart=/usr/local/bin/node servidor.js
my own day-energy calculations
I save 1-year of power sampled every 5 seconds in a RRD database, so I can produce nice graphs.
But I also store the power sampled every minute in a 1-day file.
Later, in background, we shall know the energy we produced this day,
and compare it to values provided by API.
pi@R4:~/python/pkw/eines/veure_potencia_instant $ cat 4_veure_potencia_instant.py
szPath2File = '/home/pi/python/pkw/logs/potencies'
now = datetime.datetime.now()
szTemps = now.strftime("%Y-%m-%d %H:%M:%S")
szFilename = "pot_%s.txt" % ( now.strftime("%Y_%m_%d") ) # dont use HH ni MM ni SS
szFQFN = szPath2File + '/' + szFilename
szOut = "(%s) Pprod
{%i}, Pcons
{%i}, Pdiff
{%i}.\n" % (szTemps, p_pv, p_load, p_grid)
with open( szFQFN, "a+" ) as fPot: # create file if non-existing (start of new day)
fPot.write( szOut ) # we don’t have to “file.close()” - automatically called
Cada minut s'escriu a ~/python/pkw/logs/potencies/csv/ :
*/1 * * * * /home/pi/python/pkw/eines/veure_potencia_instant/4_veure_potencia_instant.py
El format es
23:38,0,-960,960
... i ocupa 28 K al dia
archive requests
Archive requests shall be provided whenever access to historic device-data is possible.
Of course, the Datalogger Web can only provide what is stored in its internal memory
and has not been overwritten by newer data yet.
It can loose data, due to capacity reason.
The number of days stored is dependent on the number of connected units to log.
There is only one CGI to access all historic data.
This CGI contains detailed, summed, error and events queries.
Call is
http://<insert hostname or IP here>/solar_api/v1/GetArchiveData.cgi?<your query parameters>
The number of parallel queries is system wide restricted to 4 clients.
{archive} /solar_api/v1/GetArchiveData.cgi?Scope=System
date format
Strings which include information on both date and time are always in RFC3339 format with time zone offset or Zulu marker.
See Section 5.6 of RFC 3339, "Date and Time on the Internet: Timestamps"
”21.5.[20]14” dd.mm.aaaa
”5/21/[20]14” mm/dd/aaaa
”[20]14-5-21” aaaa-mm-dd
”2011-10-20T10:09:14+02:00”
”2011-10-20T10:09:14Z”
ChannelId
Each channel is handled and requested by name.
Most of the channels are recorded in constant cyclic intervals which can be set between 5 and 30 minutes.
Only Digital_PowerManagementRelay_Out_∗, InverterErrors, InverterEvents and Hybrid_Operating_State
are event triggered and may occure every time.
Values we can read, this is, available channels :
Name Unit
# TimeSpanInSec sec
# EnergyReal_WAC_Sum_Produced Wh *** energia generada en el periodo
# EnergyReal_WAC_Sum_Consumed Wh *** NULL at Fronius - SmartMeter maybe ?
# InverterErrors struct
# InverterEvents struct
# Current_DC_String_1 1 A
# Current_DC_String_2 1 A
# Voltage_DC_String_1 1 V
# Voltage_DC_String_2 1 V
# Temperature_Powerstage deg C
# PowerReal_PAC_Sum 1 W
# EnergyReal_WAC_Minus_Absolute 1 Wh
# EnergyReal_WAC_Plus_Absolute 1 Wh
no puc llegir WAC_Sum_Consumed
See page 68 of "42,0410,2012_Fronius Solar API V1_(85 pg).pdf" at "sebas@minie:~/dades/energia_solar/fronius" :
EnergyReal_WAC_Sum_Produced Wh
EnergyReal_WAC_Sum_Consumed (5) Wh
(5) introduced in Solar API CompatibilityRange Version 1.5-10 (Datamanager 3.11.1 or Hybridmanager 1.9.1)
Escric a pv-customer-spain@fronius.com (Jose Frances) i obren el cas "CAS-1758271-Q1S6B8" - cant read WAC_Sum_Consumed using python on API - 20241214 - incidencia a la central.
Conecto el Android amb la APP per cable al router i poso el ThrowingStar al mig per veure que envia el Redmi 10.
.----------. ------ .--------. .---------.
| | usc-C rj-45 | | | | | |
| Redmi 10 | ---------------------- | T-star | -------------- | Router | ------------ | Fronius |
| | | | | | | |
.----------. ------ .--------. .---------.
|
.---------------.
| T440 + Wshark |
.---------------.
Que veiem ?
- no agafa dades del Fronius, 192.168.1.229
- agafa dades encriptades de 85.31.3.249
Aixi, no podem veure el format del Request de energia consumida des la APP de Andorid
2025.02.07 - Mario Weiermaier
En relación con su consulta, el canal "EnergyReal_WAC_Sum_Consumed" solo funciona para el Ohmpilot en las solicitudes de datos archivados.
Si revisa el manual de la API Solar (sección 5.2.2, página 72), verá que este canal no devuelve información, solo lo hace "EnergyReal_WAC_Sum_Produced".
El consumo de electricidad del sistema no es un dato que se obtenga directamente del inversor o del medidor inteligente, sino que se calcula en "solar.web".
Para obtener el consumo diario, deberá solicitar los siguientes tres canales:
"EnergyReal_WAC_Sum_Produced"
"EnergyReal_WAC_Minus_Absolute"
"EnergyReal_WAC_Plus_Absolute"
La estructura de la solicitud es la misma que ya están utilizando, solo que deben incluir estos tres canales.
Luego, el consumo diario se calcula con la siguiente fórmula:
Consumo diario = "EnergyReal_WAC_Sum_Produced" - "EnergyReal_WAC_Minus_Absolute" + "EnergyReal_WAC_Plus_Absolute"
Parameters
Scope string "Device" or "System" Query specific device or whole system. Mandatory
SeriesType string "DailySum" or "Detail" resolution of the data-series. Optional
StartDate DateString ”21.5.[20]14” Mandatory
”5/21/[20]14”
”[20]14-5-21”
”2011-10-20T10:09:14+02:00”
”2011-10-20T10:09:14Z”
Llegir la energia produida cada dia des "archive"
nicolau@mars:~/sebas/python/fronius/0_from_ARCHIVE$ ./5_getArchiveData_WAC_Sum_Produced.py 2.4.2023
>>> Fetching /solar_api/v1/GetArchiveData.cgi?Scope=System&StartDate=2.4.2023&EndDate=2.4.2023&SeriesType=DailySum&Channel=EnergyReal_WAC_Sum_Produced
+++ la energia produida entre (2.4.2023) i (2.4.2023) es de (28410) {Wh}.
nicolau@mars:~/sebas/python/fronius/0_from_ARCHIVE $ ./5_getArchiveData_WAC_Sum_Produced.py 16.06.2022
>>> Fetching /solar_api/v1/GetArchiveData.cgi?Scope=System&StartDate=16.06.2022&EndDate=16.06.2022&SeriesType=DailySum&Channel=EnergyReal_WAC_Sum_Produced
+++ la energia produida entre (16.06.2022) i (16.06.2022) es de (34253) {Wh}.
sebas@minie:~/dades/python/fronius/0_from_ARCHIVE$ ./5_getArchiveData_WAC_Sum_Produced.py 28.04.2025 {dia de la apagada de 12 hores}
>>> Fetching /solar_api/v1/GetArchiveData.cgi?Scope=System&StartDate=28.04.2025&EndDate=28.04.2025&SeriesType=DailySum&Channel=EnergyReal_WAC_Sum_Produced
+++ la energia PRODUIDA entre (28.04.2025) i (28.04.2025) es de (10581) {Wh}.
Comparem amb les lectures que agafem a mitjanit - ambdos concorden.
Aixi, si alguna lectura a mitja nit falla, podem recuperar el valor.
Si la data es massa vella i no hi ha dades, rebem
sebas@minie:~/dades/python/fronius/0_from_ARCHIVE$ ./5_getArchiveData_WAC_Sum_Produced.py 2.4.2023
>>> Fetching /solar_api/v1/GetArchiveData.cgi?Scope=System&StartDate=2.4.2023&EndDate=2.4.2023&SeriesType=DailySum&Channel=EnergyReal_WAC_Sum_Produced
+++ See out/energyWAC_sum_produced.json
--- Key Error. JSON {{
A dia 2025.05.13 puc llegir 2024.06.06, pero no em dona dates de 2024.06.05 - hi tenim poc menys de un any
Llegir la energia consumida cada dia des "archive"
nicolau@mars:~/sebas/python/fronius/0_from_ARCHIVE$ ./6_getArchiveData_WAC_Sum_Consumed.py 4.2.2023
>>> Fetching /solar_api/v1/GetArchiveData.cgi?Scope=System&StartDate=4.2.2023&EndDate=4.2.2023&SeriesType=DailySum&Channel=EnergyReal_WAC_Sum_Consumed
+++ See out/energyWAC_sum_consumed.json
--- Key Error. JSON {{ ... }} # no hi ha resposta
No hi ha dades a la resposta del Fronius.
SmartMeter maybe ? No memory there !
sebas@minie:~/dades/python/fronius/0_from_ARCHIVE$ cat h_grannos_energy_consumed.sh
#!/bin/bash
hostname="fronius" # defined in /etc/hosts
endpoint="/solar_api/v1/GetArchiveData.cgi"
punter="?Scope=System"
dataInici="&StartDate=14.11.2024"
dataFinal="&EndDate=14.11.2024"
tipus="&SeriesType=DailySum"
canal1="&Channel=EnergyReal_WAC_Sum_Consumed"
canal2="&Channel=EnergyReal_WAC_Sum_Produced"
my_url="http://"$hostname$endpoint$punter$dataInici$dataFinal$tipus$canal1
echo $my_url
curl $my_url
exit 0
Funciona be amb "canal1" pero les dades de volta son buides amb "canal2"
Solucio : email ->
minie@/home/sebas/dades/python/fronius/0_from_ARCHIVE/2_get_archive_3_channels.py
monitoritzem la temperatura de l'aparell
Si demanem el resum, surt un sol valor, promig del dia :
nicolau@mars:~/sebas/python/fronius$ ./7_getArchiveData_Temperature_Powerstage.py
>>> Fetching /solar_api/v1/GetArchiveData.cgi?Scope=System&StartDate=16.6.2022&EndDate=16.6.2022&SeriesType=DailySum&Channel=Temperature_Powerstage
+++ la temperature in (16.6.2022) i (16.6.2022) is (30) {ºC}.
Si volem el detall, surt una llista de temperatures, cada 5 minuts :
nicolau@mars:~/sebas/python/fronius$ ./7_getArchiveData_Temperature_Powerstage.py
>>> Fetching /solar_api/v1/GetArchiveData.cgi?Scope=System&StartDate=16.6.2022&EndDate=16.6.2022&Channel=Temperature_Powerstage
Les marques temporals son curioses, amb increments de 300 segons, es a dir 5 minuts, comptant des "Start" :
"0": 0,
"10200": 0,
"10500": 0,
"23100": 0,
"23400": 35,
"23700": 35,
"2400": 0,
"24000": 35,
"24300": 37,
Al R0 salvem la temperatura de tot el dia a les 23:05
Dibuixem : aquest tutorial ho explica bé
rrdtool as timeseries datastore
com recorrer les dades "archive" del Fronius
Un cop al dia guardem les dades al R0 (temp, volt, amp)
De tant en tant, llegim eixes dades (escollint el dia),
filtrem els valor no desitjats, omplim un estructura adient pel "pyplot" i fem un dibuix que guardem a fitxer
Instalacio : doc,
vfy
Check install :
import matplotlib
>>> print(dir(matplotlib))
['ExecutableNotFoundError', 'MatplotlibDeprecationWarning', 'MutableMapping', 'Parameter', 'Path',
'RcParams', '_ExecInfo', '_VersionInfo', '__bibtex__', '__builtins__', '__cached__', '__doc__',
'__file__', '__getattr__', '__loader__', '__name__', '__package__', '__path__', '__spec__',
'_add_data_doc', '_all_deprecated', '_api', '_c_internal_utils', '_check_versions', '_cm', '_cm_listed',
'_color_data', '_deprecated_ignore_map', '_deprecated_map', '_deprecated_remain_as_none', '_ensure_handler',
'_enums', '_get_config_or_cache_dir', '_get_executable_info', '_get_ssl_context', '_get_version',
'_get_xdg_cache_dir', '_get_xdg_config_dir', '_init_tests', '_label_from_arg', '_log', '_logged_cached',
'_open_file_or_url', '_parse_to_version_info', '_path', '_preprocess_data', '_rc_params_in_file', '_replacer', '_version',
'atexit', 'bezier', 'cbook', 'checkdep_usetex', 'cm', 'colormaps', 'colors', 'contextlib', 'cycler',
'defaultParams', 'default_test_modules', 'docstring', 'fontconfig_pattern', 'ft2font', 'functools',
'get_backend', 'get_cachedir', 'get_configdir', 'get_data_path', 'importlib', 'inspect', 'interactive',
'is_interactive', 'is_url', 'locale', 'logging', 'matplotlib_fname', 'mplDeprecation', 'namedtuple', 'numpy',
'os', 'parse_version', 'path', 'pprint', 'rc', 'rcParams', 'rcParamsDefault', 'rcParamsOrig', 'rc_context',
'rc_file', 'rc_file_defaults', 'rc_params', 'rc_params_from_file', 'rcdefaults', 'rcsetup', 're',
'sanitize_sequence', 'scale', 'set_loglevel', 'shutil', 'subprocess', 'sys', 'tempfile', 'test', 'ticker',
'transforms', 'use', 'validate_backend', 'warnings']
>>> matplotlib._version
<module 'matplotlib._version' from '/home/pi/.local/lib/python3.7/site-packages/matplotlib/_version.py'>
$ python3 -c 'import matplotlib; print(matplotlib.__version__, matplotlib.__file__)'
Step by step : install/remove
pi@pi0:~/python/fronius $ python -V
Python 2.7.16
pi@pi0:~/python/fronius $ python -m pip check
pygobject 3.30.4 requires pycairo, which is not installed.
pi@pi0:~/python/fronius $ python -m pip help # list of commands
pi@pi0:~/python/fronius $ python -m pip install --upgrade pip
Looking in indexes: https://pypi.org/simple, https://www.piwheels.org/simple
Collecting pip
Downloading https://files.pythonhosted.org/packages/27/79/8a850fe3496446fd2d02789accf7/pip-20.3.4-py2.py3-none-any.whl (1.5MB)
100% |████████████████████████████████| 1.5MB 55kB/s
Installing collected packages: pip
Successfully installed pip-20.3.4
pi@pi0:~/python/fronius $ python -m pip install -U matplotlib
DEPRECATION: Python 2.7 reached the end of its life on January 1st, 2020.
pi@pi0:~/python/fronius $ python3 -m pip install --upgrade pip
Looking in indexes: https://pypi.org/simple, https://www.piwheels.org/simple
Cache entry deserialization failed, entry ignored
Cache entry deserialization failed, entry ignored
Collecting pip
Downloading https://files.pythonhosted.org/packages/84/25/5734a448ac6822ed7d48102952cb/pip-22.2.1-py3-none-any.whl (2.0MB)
100% |████████████████████████████████| 2.0MB 44kB/s
Installing collected packages: pip
Successfully installed pip-22.2.1
pi@pi0:~/python/fronius $ python3 -m pip install -U matplotlib
Successfully installed
cycler-0.11.0 fonttools-4.34.4 kiwisolver-1.4.4 matplotlib-3.5.2 numpy-1.21.6
packaging-21.3 pillow-9.2.0 pyparsing-3.0.9 python-dateutil-2.8.2 typing-extensions-4.3.0
pi@pi0:~/python/fronius $ ./z_extract_temp_2_json.py
Traceback (most recent call last):
File "./z_extract_temp_2_json.py", line 9, in <module>
import matplotlib.pyplot as plt
ImportError: No module named matplotlib.pyplot
pi@pi0:~/python/fronius $ sudo apt update
pi@pi0:~/python/fronius $ sudo apt-get dist-upgrade
pi@pi0:~/python/fronius $ sudo apt install python3-matplotlib
pi@pi0:~/python/fronius $ python3 -c "from pylab import *; set_loglevel('debug'); plot(); show()"
Traceback (most recent call last):
File "<string>", line 1, in <module>
File "/home/pi/.local/lib/python3.7/site-packages/pylab.py", line 1, in <module>
from matplotlib.pylab import *
File "/home/pi/.local/lib/python3.7/site-packages/matplotlib/__init__.py", line 109, in <module>
from . import _api, _version, cbook, docstring, rcsetup
File "/home/pi/.local/lib/python3.7/site-packages/matplotlib/rcsetup.py", line 27, in <module>
from matplotlib.colors import Colormap, is_color_like
File "/home/pi/.local/lib/python3.7/site-packages/matplotlib/colors.py", line 51, in <module>
from PIL import Image
File "/home/pi/.local/lib/python3.7/site-packages/PIL/Image.py", line 100, in <module>
from . import _imaging as core
ImportError: libopenjp2.so.7: cannot open shared object file: No such file or directory
pi@pi0:~/python/fronius $ sudo apt-get install libopenjp2-7
pi@pi0:~/python/fronius $ ./z_extract_temp_2_json.py
Matplotlib is building the font cache; this may take a moment.
>>> read ./out/temp_2022-07-30.json
--- file {./out/temp_2022-07-30.json} does not exist
API access
bash
bash - read day produced energy
sebas@minie:~/dades/python/fronius/0_from_ARCHIVE$ ./0_test_api.sh
http://fronius/solar_api/v1/GetInverterRealtimeData.cgi?Scope=Device&DeviceId=1&DataCollection=CommonInverterData
{
"Body" : {
"Data" : {
"DAY_ENERGY" : { ; ***
"Unit" : "Wh", ; ***
"Value" : 19874 ; ***
},
"DeviceStatus" : {
"ErrorCode" : 307,
"LEDColor" : 1,
"LEDState" : 0,
"MgmtTimerRemainingTime" : 11,
"StateToReset" : false,
"StatusCode" : 3
},
"IDC" : {
"Unit" : "A",
"Value" : 0
},
"TOTAL_ENERGY" : {
"Unit" : "Wh",
"Value" : 18833790
},
"UDC" : {
"Unit" : "V",
"Value" : 2.8999999999999999
},
"YEAR_ENERGY" : {
"Unit" : "Wh",
"Value" : 6026161
}
}
},
"Head" : {
"RequestArguments" : {
"DataCollection" : "CommonInverterData",
"DeviceClass" : "Inverter",
"DeviceId" : "1",
"Scope" : "Device"
},
"Status" : {
"Code" : 0,
"Reason" : "",
"UserMessage" : ""
},
"Timestamp" : "2024-10-04T22:01:31+02:00"
}
}
python
We can use requests :
import requests
my_url = "http://" + hostname + endpoint #
try:
resp = requests.get( my_url, timeout=60 ) #
resp.raise_for_status() #
if resp.status_code == 200:
jsondata = resp.json() #
except requests.exceptions.HTTPError as errh: #
python 3 only
print ("--- Http Error:", errh)
raise SystemExit(errh)
except requests.exceptions.ConnectionError as errc:
print ("--- Error Connecting:", errc)
except requests.exceptions.Timeout as errt:
print ("--- Timeout Error:", errt)
except requests.exceptions.TooManyRedirects: # tell user the URL was bad
print ( '--- redirect.')
except requests.exceptions.RequestException as errex: #
python 3 only
raise SystemExit(errex)
Or urllib.request
import urllib.request # ubuntu Python 3.7.5
import urllib # raspbian Python 2.7.16
my_url = "http://" + hostname + endpoint
with urllib.request.urlopen( my_url, timeout=10 ) as url:
objjson = json.loads( url.read().decode() )
Millor sense el "with" : urllib.urlopen
try:
szDades = urllib.urlopen( my_url ).read().decode(encoding='UTF-8').strip()
objjson = json.loads( szDades )
except HTTPError as errh:
# do something
print('--- HTTP error - code: ', errh.code)
except URLError as erru:
# do something
print('--- URL error - reason: ', erru.reason)
python and JSON
using JSON
python and opening URLs
Details on opening URLs
python "connection refused"
20220725 :
nicolau@mars:~/sebas/python/fronius$ ./ramon.py
>>> (1) Read (/solar_api/v1/GetInverterRealtimeData.cgi?Scope=System).
--- error connecting: HTTPConnectionPool(host='fronius', port=80):
Max retries exceeded with url: /solar_api/v1/GetInverterRealtimeData.cgi?Scope=System
(Caused by NewConnectionError('<urllib3.connection.HTTPConnection object at 0x7fd107811c10>:
Failed to establish a new connection: [Errno 111] Connection refused'))
>>> (2) Read (/solar_api/v1/GetMeterRealtimeData.cgi?Scope=System).
--- URL error [Errno 111] Connection refused
>>> (3) Read (/solar_api/v1/GetPowerFlowRealtimeData.fcgi).
--- URL error [Errno 111] Connection refused
URLs python access
nodejs
http = require('socket.http')
json = require('json')
url = 'http://fronius/solar_api/v1/GetMeterRealtimeData.cgi?Scope=System'
resp = http.request(url)
data = json.decode(resp).Body.Data['0']
grp.checkupdate('1/1/1', data.Current_AC_Sum)
grp.checkupdate('1/1/2', data.Current_AC_Phase_1)
grp.checkupdate('1/1/3', data.Voltage_AC_Phase_1)
forum logicmachine
php
PHP code
Lets do it from MARS :
$ sudo apt install php7.2-cli
nicolau@mars:~$ php -v
PHP 7.2.24-0ubuntu0.18.04.11 (cli) (built: Mar 2 2022 17:52:35) ( NTS )
Copyright (c) 1997-2018 The PHP Group
Zend Engine v3.2.0, Copyright (c) 1998-2018 Zend Technologies
with Zend OPcache v7.2.24-0ubuntu0.18.04.11, Copyright (c) 1999-2018, by Zend Technologies
sudo apt install hhvm -> HHVM is an open-source virtual machine designed for executing programs written in Hack and PHP ->
install HHVM {no cal}
forum.pvoutput.org
Forum ben interessant ...
push log data
nicolau@mars:~/sebas/php$ php getFroniusData.php
PHP Notice: date_default_timezone_set(): Timezone ID 'Spain/Madrid' is invalid in /home/nicolau/sebas/php/getFroniusData.php on line 11
github grann0s
github :
go to settings, enable API and get API Key ("9999") and SystemID ("88888")
Service URL : https://pvoutput.org/service/r2/addoutput.jsp
nicolau@mars:~/sebas/php$ php pushPVStringData.php
https://pvoutput.org/service/r2/addstatus.jsp?key=PVOUTPUTAPIKEY&sid=PVOUTPUT_SID&d=20220705&t=12:50&v7=2750.816&v8=0&v9=48
nicolau@mars:~/sebas/php$ php pushPVStringData.php
https://pvoutput.org/service/r2/addstatus.jsp?key=9999&sid=canSebas&d=20220705&t=13:00&v7=2746.959&v8=0&v9=48
PHP Warning: file_get_contents(https://pvoutput.org/service/r2/addstatus.jsp?key=9999&sid=canSebas&d=20220705&t=13:00&v7=2746.959&v8=0&v9=48):
failed to open stream: HTTP request failed! HTTP/1.1 401 Unauthorized
in /home/nicolau/sebas/php/pushPVStringData.php on line 134
nicolau@mars:~/sebas/php$ php pushPVStringData.php
https://pvoutput.org/service/r2/addstatus.jsp?key=9999&sid=88888&d=20220705&t=13:05&v7=2747.902&v8=0&v9=48
PHP Warning: file_get_contents(https://pvoutput.org/service/r2/addstatus.jsp?key=9999&sid=88888&d=20220705&t=13:05&v7=2747.902&v8=0&v9=48):
failed to open stream: HTTP request failed! HTTP/1.1 400 Bad Request
in /home/nicolau/sebas/php/pushPVStringData.php on line 134
nicolau@mars:~/sebas/php$ php pushPVStringData.php
https://pvoutput.org/service/r2/addoutput.jsp?key=9999&sid=88888&d=20220705&t=13:20&v7=2725.04&v8=0&v9=48
... pero no arriba l'altre cantó ...
Es recomana un "cron" :
*/5 * * * * root /usr/bin/php /root/pushPVStringData.php >> /root/pushPVStringData.log
dubtes API Fronius
- com es que NO puc llegir el voltatge o el corrent produits ara mateix (realtime),
o la temperatura actual,
i si que puc llegir-los des fitxer (archive requests) ?
Current_DC_String_1
Current_DC_String_2
Voltage_DC_String_1
Voltage_DC_String_2
Temperature_Powerstage
- si hi ha un "reset" del Fronius (que n'hi ha), on queda guardada la causa ?
- si llegeixo un valor durant 1 dia (as "Temperature_Powerstage"), que son les marques temporals que van de 300 en 300 ?
Son els segons des l'origen : "__OFFSET_IN_SECONDS__"
nicolau@mars:~/sebas/python/fronius/0_from_ARCHIVE/out$ cat temperature.json
{
"Body": {
"Data": {
"inverter/1": {
"Data": {
"Temperature_Powerstage": {
"Unit": "ºC",
"Values": {
"0": 0,
"10200": 0,
...
"52500": 57,
"52800": 57, --- 14 h 40 min !!!
"5400": 0,
"5700": 0,
"600": 0,
"6000": 0,
"push" service
Using the Fronius Push Service, system data can be sent directly from any Fronius SnapINverter or Fronius Datamanager (1.0 / 2.0)
to any server to be used as you desire.
Various data formats are available (for example, XML and JSON).
Supported protocols: HTTP POST and FTP upload.
formats
"push" details
42,0410,2152_Operating Instruction Fronius Push Service_DE_i_EN.pdf :
At present the only way to communicate with the Fronius push service is to make an HTTP request to a specific URL.
Application interface
The current state can be requested be performing an HTTP get request:
http://<host name or IP of Datamanager>/status/pushservice/
nicolau@mars:~$ curl http://fronius/status/pushservice/
curl: (7) Failed to connect to fronius port 80: Connection refused
nicolau@mars:~$ curl http://fronius/status/pushservice/
<?xml version="1.0" encoding="iso-8859-1"?>
<!DOCTYPE html PUBLIC "-//W3C//DTD XHTML 1.0 Transitional//EN"
"http://www.w3.org/TR/xhtml1/DTD/xhtml1-transitional.dtd">
<html xmlns="http://www.w3.org/1999/xhtml" xml:lang="en" lang="en">
<head>
<title>401 Unauthorized</title>
</head>
<body>
<h1>401 Unauthorized</h1>
</body>
</html>
push() to pvoutput.org
PVOutput is a free online service for sharing and comparing photovoltaic solar panel output data.
It provides both manual and automatic data uploading facilities.
Homepage,
API specificacion,
list user 104774,
sys id "canSebas"
Using a push service requires a PVOutput API key and System Id.
Refer to
Service API on how to obtain the SystemId and API Key
push() config sample
Servicio "Push"
+ Añadir
Name: push to PVOUTPUT Estado: se ha realizado con exito hace 2 minutos
Descripcion: Fronius Push to PVOutput
Formato de datos: SolarAPI v1 - CurrentData - Inverter mediante HTTP POST
Intervalo: 5 min Activado ✔
Servidor: Puerto: pvoutput.org:80
Carga del nombre de archivo: /service/r2/froniuspost.jsp?sid=your_sid&key=your_key
Login: unchecked
[/] Replace your_sid with the System Id and your_key with the PVOutput API Key.
URLs de pvoutput.org
modbus
wiki :
Modbus is a data communications protocol originally published by Modicon (now Schneider Electric) in 1979 for use with its programmable logic controllers (PLCs).
Fronius docu
Que es ?
Modbus SunSpec is an open, Modbus-based communication protocol that conforms to the SunSpec Alliance standard.
Modbus TCP (Ethernet) is available for the following products: Fronius Datamanager Card 1.0, Card 2.0 or Box 2.0
TG by "R.C."
Structure of a Modbus message for Modbus TCP
[MBAP header] [function code] [data]
MBAP = MODBUS application protocol header
[MBAP header] :
Transaction ID (2 bytes) - used to synchronize request and response.
The slave adopts the transaction ID from the request into the response.
Protocol ID (2 bytes) - always 0
Length (2 bytes) - number of bytes of the subsequent fields, including unit ID and data fields.
Unit ID (1 byte)
Supported function codes :
03 (0x03) read holding registers
06 (0x06) write single register
16 (0x10) write multiple registers
If an error occurs on the slave during the processing of a request,
an error message is sent as the response (exception response).
The most significant bit of the function code is set to 1 (corresponds to adding 0x80 to the function code)
and an exception code is added, which indicates the reason for the error.
pyModbusTCP.client + readHoldingRegs
Modbus "Read Holding Registers", function code 03, reads between 1 and 125 holding registers from the PLC.
The request PDU consists of 5 bytes:
Offset Length Description Values
------- ------- ------------ -------
0 Byte Function Code 03
2 Word First Input Address 0000h - FFFFh
4 Word Register Count 0001 - 007Dh
The normal response varies in length from 4 bytes up to 252 bytes depending on the number of holding registers requested:
Offset Length Description Values
------- ------- ------------ -------
0 Byte Function Code 03
1 Byte Byte Count RegisterCount * 2
2 N Bytes Register data ...
Note: The total number of bytes returned is 2 + ( 2 * RegisterCount ), where RegisterCount is the number of holding registers requested.
fernhillsoftware
Fronius Datamanager Register Map
Mapes at "/home/nicolau/sebas/energia_solar/fronius/modbus/SE_EI_Modbus_Sunspec_Maps_State_Codes_Events"
http://www.fronius.com/QR-link/0006 -> SE_EI_Modbus_Sunspec_Maps_State_Codes_Events_EN.zip
- Integer Meter Model (201, 202, 203) - Meter_Register_Map_Int&SF_v1.0_201a203.xlsx
- Floating Point Meter Model (211, 212, 213) - Meter_Register_Map_Float_v1.0_211a213.xlsx
- Fronius Datamanager Register Map: Integer Inverter Model (101, 102, 103) - mapa_registros_Fronius_101a103.xlsx
40001 40002 SID : Uniquely identifies this as a SunSpec Modbus Map
40003 40003 ID : Uniquely identifies this as a SunSpec Common Model block
40004 40004 L : Length of Common Model block
40005 40020 Mn : Manufacturer, "Fronius"
40021 40036 Md : Device model, "Primo 5.0-1"
40037 40044 Opt : Firmware version of Datamanager
40045 40052 Vr : SW version of inverter
40053 40068 SN : Serial number of the inverter
40069 40069 DA : Modbus Device Address
modbus python library
pyModbusTCP
project,
documentation,
PDF,
github (install)
nicolau@mars:~/sebas/python/fronius/modbus$ sudo pip install pyModbusTCP
Requirement already satisfied: pyModbusTCP in /usr/local/lib/python3.7/dist-packages (0.2.0)
ModbusClient internals
See client docs :
>>> print(dir(ModbusClient))
['_InternalError', '_ModbusExcept', '_NetworkError', '__class__', '__del__', '__delattr__', '__dict__', '__dir__', '__doc__',
'__eq__', '__format__', '__ge__', '__getattribute__', '__gt__', '__hash__', '__init__', '__init_subclass__',
'__le__', '__lt__', '__module__', '__ne__', '__new__', '__reduce__', '__reduce_ex__', '__repr__',
'__setattr__', '__sizeof__', '__str__', '__subclasshook__', '__weakref__', '_add_mbap', '_debug_dump', '_debug_msg',
'_open', '_pretty_dump', '_recv', '_recv_all', '_recv_pdu', '_req_except_handler', '_req_init', '_req_pdu',
'_send', '_send_pdu', 'auto_close', 'auto_open', 'close', 'custom_request', 'debug', 'host',
'is_open', 'last_error', 'last_error_as_txt', 'last_except', 'last_except_as_full_txt', 'last_except_as_txt',
'open', 'port', 'read_coils', 'read_discrete_inputs', 'read_holding_registers', 'read_input_registers',
'timeout', 'unit_id', 'version', 'write_multiple_coils', 'write_multiple_registers', 'write_single_coil', 'write_single_register']
ModbusClient sample
nicolau@mars:~/sebas/python/fronius/modbus$ cat minim.py
#!/usr/bin/env python
# -*- coding: utf-8 -*-
SERVER_HOST = 'fronius'
SERVER_PORT = 502
from pyModbusTCP.client import ModbusClient
cli = ModbusClient( host=SERVER_HOST, port=SERVER_PORT, auto_open=True, auto_close=True, debug=True )
if not cli.is_open:
if not cli.open():
print("--- unable to connect to "+SERVER_HOST+":"+str(SERVER_PORT))
else:
print("+++ open() success")
else:
print("+++ is_open")
ModbusClient first right read
Using this code
nicolau@mars:~/sebas/python/fronius/modbus$ cat ./3.py
#!/usr/bin/env python3
# -*- coding: utf-8 -*-
#
https://github.com/sourceperl/pyModbusTCP
#
documentation
#
ModbusClient
from pyModbusTCP.client import ModbusClient
SERVER_HOST = "fronius"
SERVER_PORT = 502
iAddr = 40001
iLong = 70
try:
cli = ModbusClient( host=SERVER_HOST, port=SERVER_PORT, auto_open=True, debug=True ) # init modbus client : TCP always open
if cli.open():
print( '>>> read', iLong, 'registers ( hex', hex(iLong), ') starting at', iAddr, '( hex', hex(iAddr), ').' )
regs_list =
cli.read_holding_registers( iAddr -1, iLong ) # mind "-1"
if regs_list:
print( '+++ registers: {%s}.' % regs_list )
else:
print('--- unable to read registers')
cli.close()
except ValueError as ve:
print( "--- value error : ", ve ) # as "host or port params"
... we get :
nicolau@mars:~/sebas/python/fronius/modbus$ ./3.py
>>> read 70 registers ( hex 0x46 ) starting at 40001 ( hex 0x9c41 ).
Tx
[70 76 00 00 00 06 01] 03 9C 40 00 46 compte @ = 0x9c40 !
Rx
[70 76 00 00 00 8F 01] 03 8C "no error" + byte count
40001 53 75 6E 53 SID = x'53 75 6e 53' ('SunS')
40003 00 01 ID
40004 00 41 L
40005 46 72 6F 6E 69 75 73 00 00 00 00 00 00 00 00 00 Mn "Fronius" = x'46 72 6F 6E 69 75 73'
00 00 00 00 00 00 00 00 00 00 00 00 00 00 00 00
40021 50 72 69 6D 6F 20 35 2E 30 2D 31 00 00 00 00 00 Md "Primo 5.0-1"
00 00 00 00 00 00 00 00 00 00 00 00 00 00 00 00
40037 33 2E 32 30 2E 36 2D 31 00 00 00 00 00 00 00 00 Opt "3-20-6-1"
40045 30 2E 33 2E 32 37 2E 32 00 00 00 00 00 00 00 00 Vr "0-193718"
40053 33 33 31 39 33 37 31 38 00 00 00 00 00 00 00 00 *** SN *** 33193718 ***
00 00 00 00 00 00 00 00 00 00 00 00 00 00 00 00
40069 00 01 DA, device address
40070 00 65 ID (101, 102, 103) x'65 = d'101
ModbusClient read manufacturer
nicolau@mars:~/sebas/python/fronius/modbus$ ./3.py 40005 4
>>> read 4 registers ( hex 0x4 ) starting at 40005 ( hex 0x9c45 ).
Tx
[E6 D6 00 00 00 06 01] 03 9C 44 00 04
Rx
[E6 D6 00 00 00 0B 01] 03 08 46 72 6F 6E 69 75 73 00
{0}-{0x4672/0x46-0x72/F+r}
{1}-{0x6F6E/0x6f-0x6e/o+n}
{2}-{0x6975/0x69-0x75/i+u}
{3}-{0x7300/0x73-0x00/s+ }
ModbusClient Meter Model Register
Pg 99 de "42,0410,2049_operating Instructions fronius datamanager - modbus TCP and RTU.pdf"
The data of an energy meter connected with the Fronius Datamanager via Modbus RTU
can be read by the relevant SunSpec models via Modbus TCP.
Fem servir "mapa_registros_Fronius_101a103.xlsx", doncs tenim un model "101", single phase
URLS modbus
Data storage
We need a TSDB = time series database
- round robin database, rrdb -
wiki RRDtool
- influxdata :
how to visualize -
There are many types of dashboards to choose from, such as those that come with InfluxDB,
other open source projects like Grafana, ...
- Graphite supports reading data from rrd files
Gràcies, Pere !
TSDB visualization
Dashboards are a great way to visualize and present time series data
7 powerful Time-Series Database for monitoring solution
plotly libraries
RRDtool concepts and URLs
rrdtool de'n Pere
hietala, cada 300 segons
En Albert te un "PiHeat" a github amb rrdtool
En Albert te un projecte ben xulu :
PiHeat 
Despres de la instalacio i les inicialitzacions, funciona amb el crontab :
#
# piheat crontab
#
# Schedule sampling temperature and humidity into rrd
# Automatically update images for the http server
#
SHELL=/bin/sh
PATH=/usr/local/sbin:/usr/local/bin:/sbin:/bin:/usr/sbin:/usr/bin
# generate and save new samples
*/1 * * * * root /usr/bin/piheat-cli dump
# regenerate graph images
*/1 * * * * root /usr/bin/piheat-cli graph
# detect temperature thresholds
*/1 * * * * root /usr/bin/piheat-cli alert
Els punts claus son :
{initialize.py} rrdtool.create ( rrd_filename,
{cron -> piheat-cli dump -> reader.py} piheat.reader.write(rrd_filename, t, h, p)
rrdtool.update ( rrd_filename, '{}:{}:{}:{}'.format(time_mark, temperature, humidity, pitemp) )
{cron -> piheat-cli graph -> graph.py} piheat.graph.render(rrd_filename,
rrdtool.graph ( rrd_filename, '--imgformat', 'PNG',
3 dubtes : {solucio : paket Debian}
- quan es posa el crontab dins el sistema, quan s'engega "piheat -> cron -> piheat"
- des on es crida "piheat-cli.initialize", per a "crear" el fitxer i demes : piheat.postinst
- quan es posa al sistema el servei "piheat.service" : piheat.postinst
Diferencies :
- jo no tindré un servidor web local, sino que faré un FTP a byet.host, free hosting
Un altre projecte similar :
Smart Meter amb RRDtool al Raspberry
Un "create" + "update" + "graph" sample
Plot kW at R4 - agafar la potencia produida cada 5 segons
Volem q el R4 llegeixi JSON del Fronius i faci 4 grafiques.
Projecte al github {gitlab}
Be, essiguem una mica mes ambiciosos - volem un programa que :
- in : periode, as (from 2022-02-14 to 2022-03-11)
- out : kWh que he (comprat/vengut) + diners que he de (pagar/cobrar)
Detalls
1) que tinc (en una RRDB)
La crida mes adienta la API del Fronius ens proporciona :
la potencia que estic generant -> produccio de les plaques solars
la potencia que estic consumint -> consum dels aparells de casa meva
la potencia que estic venent o comprant de la xarxa -> indica si pago o cobro
a) cada 5 segons poso a la RRDB (1) aquestos 3 valors, per fer grafiques maques
b) cada minut poso en un fitxer de texte (CSV) aquestos 3 valors, per calcular la factura de un periode
Tambe tinc :
c) preu que REE em paga per la energia que li venc (en fanges horaries) -> PCEX
d) preu que REE em cobra per la energia que li compro (en fanges horaries) -> PVPC
2) que vull fer : calcular la meva factura per un periode
Per exemple, del 2 de Abril de 2022 a les 11 h al 3 de Maig de 2022 a les 12 h
Endesa : dies sencers
Aixi, entenc que el algorisme ha de ser mes o menys aixi
agafar les tarifes de REE que corresponen a aquesta hora
per cada interval (1 minut) dintre del periode a facturar (2022.04.02 -> 2022.05.03)
comptar quanta energia he vengut en aquest minut = eVenc
comptar quanta energia he comprat en aquest minut = eComp
acumular quanta energia he vengut en tot el periode -> eVenc_Periode := eVenc_Periode + eVenc
acumular quanta energia he comprat en tot el periode -> eComp_Periode := eComp_Periode + eComp
comptar quants diners he de cobrar per la energia venuda en aquesta hora = eVenc * PCEX = moni_Venda
comptar quants diners he de pagar per la energia comprada en aquesta hora = eComp * PVPC = moni_Compra
acumular diners a cobrar per tot el periode -> moni_Venda_Periode
acumular diners a pagar per tot el periode -> moni_Compra_Periode
passar al periode seguent (incrementar la data en 1 minut) -> possible canvi de hora i de dia
si hi ha hagut canvi de dia
agafar les tarifes de REE que corresponen a aquesta hora
3) detalls :
(*) els preus que em dona REE (PCEX i PVPC) son en un fitxer JSON de 4 k (PCEX) i 21 K (PVPC)
(*) la potencia generada cada minut de un dia es un fitxer de texte amb format CSV
(timestamp, potencia generada, potencia consumida, potencia xarxa)
12:04,1729,-1635,-93
12:05,1717,-1629,-87
12:06,1727,-1647,-79
Organitzacio dels fitxers del projecte
Fem codi al R4 :
~/python/pkw <--- "plot kW del Fronius"
|
/bin <--- per separar de "dades" o "cron"
| |
| pkw_cli.py <--- el "client" - conte "import pkw_pkg" !!!!!
| |
| /pkw_pkg <--- el "package" amb les funcions
| | |
| | __init__.py
| | pkw_initialize.py <--- inicialitzacions
| | pkw_graph.py <--- fa grafiques amb les dades del RRDT
| | pkw_reader.py <--- llegeix del Fronius i escriu al RRDT
|
/cron
| |
| cada_5_segons.sh <--- llegir Fronius cada 5 segons
| pkw.crontab <--- fer grafiques cada 5 minuts ... i mes coses
|
/dades <--- s'hi guarda el fitxer RRDT i els PNG de les grafiques
| |
| pkw.rrd <--- main RRD file, 1 year = 151.615.900 bytes
| pkw.xml <--- dump RRD into XML once in a while
| pkw_1-60m.png
| pkw_2-8h.png
| pkw_3-24h.png
| pkw_4-7days.png
| pkw_5-beh.png <--- balance energia hoy - nice graph at
solarweb : kWh (in/out)
| |
| /potencies <--- potencies llegides cada minut
| | |
| | pot_2022_05_26.txt <--- potencies del dia, en TXT
| | |
| | /csv
| | | |
| | | pot_CSV_2022_05_26.csv <--- potencies del dia, en CSV
| |
| /ree <--- fitxers llegits de REE 1 cop al dia (publiquen els preus del endema a les 20:30)
| | |
| | /pcex
| | | |
| | | preu_PCEX_Y2022-M05-D16.json <--- preu que paga REE en comprar la meva energia (24 fanjes horaries)
| | |
| | /pvpc
| | | |
| | | preu_PVPC_Y2022-M05-D16.json <--- preu que pago quan compro energia a REE
|
/eines
| |
| /analitzar_un_dia .
| | |
| | energia_1_dia.py <--- per calcular la energia produida en 1 dia ... [a] /pkw/logs/energia_pkw.log
| | extreure_1_dia.sh <--- ... amb FETCH extreiem del pkw.rdd les dades del dia (Pprod, Pcons, Pdiff) ...
| | acumular_1_dia.py <--- ... i les acumulem per obtenir kWh
| |
| /llegir_energia_generada_avui
| | |
| | 8_llegir_energia_generada_avui.py <--- /pkw/logs/energia_api.log (comparem amb [a])
| |
| /proves
| |
| /ree <--- {crontab}
| | |
| | 1_get_preu_pvpc.sh <--- {crontab 23:00} escriu 1 fitxer al dia a /python/pkw/logs/ree/pvpc/
| | 2_get_preu_excedente.sh <--- {crontab 23:05} escriu 1 fitxer al dia a /python/pkw/logs/ree/pcex/
| |
| /veure_potencia_instant <---
| | |
| | 4_veure_potencia_instant.py <--- {crontab 1 minut} escriu 1 fitxer per dia a /python/pkw/logs/potencies
|
/logs
| |
| pkw_dump.log <--- log de la lectura del Fronius
| pkw_graph.log <--- log de la generacio de les grafiques
| |
| /potencies <--- un fitxer per dia amb la potencia llegida cada minut {crontab}
|
/projecte
| |
| history.txt <--- history of the project milestones
| to_do.txt <--- thing to do
|
Crida a la API del Fronius des el R4
pi@R4:~/python/pkw/bin/pkw_pkg $ cat pkw_reader.py
import urllib
def defronius(simulate=False):
if simulate:
import random
pp = '{}'.format(random.randint(0, 80))
pc = '{}'.format(random.randint(0, 100))
pd = '{}'.format(random.randint(0, 100))
else: # get real data from Fronius
endpoint = "/solar_api/v1/GetPowerFlowRealtimeData.fcgi"
my_url = "http://" + hostname + endpoint
print( ">>> (2) Read (%s)." % endpoint )
szDades = urllib.urlopen( my_url ).read().decode(encoding='UTF-8').strip()
objjson = json.loads( szDades ) #
p_pv = objjson["Body"]["Data"]["Site"]["P_PV"] # potencia produida, W, sempre (+)
p_load = objjson["Body"]["Data"]["Site"]["P_Load"] # ( + generator , - consumer )
p_grid = objjson["Body"]["Data"]["Site"]["P_Grid"] # ( + from grid , - to grid )
if p_pv is None: # this value is "Null" if inverter is not running ...
p_pv = 0 ; # ... so fix it not to have a runtime error
pp = '%d' % p_pv
pc = '%d' % p_load
pd = '%d' % p_grid
return pp, pc, pd # potencia produida, potencia consumida, potencia comprada o venuda (diff)
Crides a RRDtool des la command line
pi@R4:~$ rrdtool
RRDtool 1.7.1 Copyright by Tobias Oetiker <tobi@oetiker.ch>. Compiled May 30 2019 20:28:06
Usage: rrdtool [options] command command_options
Valid commands:
create, update, updatev, graph, graphv, dump, restore,
last, lastupdate, first, info, list, fetch, tune,
resize, xport, flushcached
O tambe :
pi@R4:~$ python
Python 2.7.16 (default, Oct 10 2019, 22:02:15)
[GCC 8.3.0] on linux2
Type "help", "copyright", "credits" or "license" for more information.
>>> import rrdtool
>>> dir(rrdtool)
['OperationalError', 'ProgrammingError', '__doc__', '__file__', '__name__', '__package__', '__version__',
'clear_fetch_cb', 'create', 'dump', 'fetch', 'first', 'flushcached', 'graph', 'graphv',
'info', 'last', 'lastupdate', 'lib_version', 'list', 'register_fetch_cb', 'resize',
'tune', 'update', 'updatev', 'xport']
python rrdtool.create
Documentacio
create command
Si fem una mostra cada 5 segons i volem guardar 1 any, quantes entrades ("rows") ens calen ?
1 mostra / 5 seg ; 12 mostres / 1 minut ; 720 mostres / 1 hora ; 17.280 mostres / 1 dia ; 6.307.200 mostres / 365 dies o 1 any.
Fem :
data_sources=[ 'DS:Pprod:GAUGE:180:0:80', # DS:ds-name:{GAUGE|COUNTER|DERIVE|DCOUNTER|DDERIVE|ABSOLUTE}:heartbeat:min:max
'DS:Pcons:GAUGE:180:0:100', # minimal_heartbeat
'DS:Pdiff:GAUGE:180:0:100' #
]
rrdtool.create( rrd_filename,
'--step', '5', # the base interval in seconds with which data will be fed into the RRD
'--start', 'now - 7d',
data_sources,
'RRA:MAX:0.5:1:6307200') # RRA:{AVERAGE | MIN | MAX | LAST}:xff:steps:rows
Mind the "RRA steps" :
steps defines how many of these primary data points are used to build a consolidated data point which then goes into the archive
Si fem servir la eina "info", veiem
pi@R4:~/python/pkw/bin $ ./pkw_cli.py info
{2022-05-12 18:18:26} >>> info ...
{
"step": 5,
"filename": "/home/pi/python/pkw/dades/pkw.rrd",
"rrd_version": "0003",
"last_update": 1652372304,
"header_size": 1180,
"rra[0].cdp_prep[0].value": null,
"rra[0].cdp_prep[1].unknown_datapoints": 0,
"rra[0].pdp_per_row": 1,
"rra[0].cdp_prep[0].unknown_datapoints": 0,
"rra[0].cdp_prep[2].unknown_datapoints": 0,
"rra[0].cf": "MAX",
"rra[0].cur_row": 3259,
"rra[0].cdp_prep[2].value": null,
"rra[0].rows": 6307200,
"rra[0].cdp_prep[1].value": null,
"ds[Pprod].index": 0,
"ds[Pprod].minimal_heartbeat": 180,
"ds[Pprod].last_ds": "1379", # que es ? last datastamp ?
"ds[Pprod].unknown_sec": 0,
"ds[Pprod].type": "GAUGE",
"ds[Pdiff].index": 2,
"ds[Pdiff].minimal_heartbeat": 180,
"ds[Pdiff].unknown_sec": 4,
"ds[Pdiff].last_ds": "-1208",
"ds[Pdiff].value": null,
"ds[Pdiff].type": "GAUGE",
"ds[Pcons].index": 1,
"ds[Pcons].minimal_heartbeat": 180,
"ds[Pcons].last_ds": "-170",
"ds[Pcons].unknown_sec": 4,
"ds[Pcons].value": null,
"ds[Pcons].type": "GAUGE"
}
DB parameters
The "heartbeat" defines the maximum acceptable interval between samples/updates.
If the interval between samples is less than "heartbeat", then an average rate is calculated and applied for that interval.
If the interval between samples is longer than "heartbeat", then that entire interval is considered "unknown".
oss.oetiker
The step size is the smallest time interval in the RRD file.
By default, this is 300 sec (5 min) though you can specify it smaller or larger if necessary at creation time.
Generally, you would set this to be the expected amount of time between data samples;
so if your samples come approximately every 5 min, you set this to 5 min.
The heartbeat is the maximum amount of time between samples before they are deemed unknown.
This is an indicator of the irregularity of samples.
In general, this would be twice the expected sample interval; so if your samples come every 5 min, set this to 600 s (10 min).
If there is a gap larger than this, the sample range is marked 'unknown'.
The XFF is the proportion of DS data points making up an RRA consolidated data point which can be unknown before the consolidated data point becomes unknown.
Generally, this is set to 0.5, but can be higher if you want (e.g. 0.9).
stackoverflow
When creating an RRD database we'll need to specify a couple things, namely one or more Data Sources and one or more Round Robin Archives.
- the data source (DS) defines what type of data is accepted and some boundaries on what constitutes good data.
Format : DS:ds-name:{GAUGE|COUNTER|DERIVE|DCOUNTER|DDERIVE|ABSOLUTE}:heartbeat:min:max
The min and max specify a range for "good" values; if a value is outside of this range it is said to be unknown.
Min - the minimum acceptable value. Values less than this number are considered unknown. This is optional. Specify "U" (unknown) to not set a min
Max - the maximum acceptable value. Values exceeding this number are considered unknown. This is optional. Specify "U" (unknown) to not set a max
- the round robin archives (RRA) can almost be thought of as views, it defines the different ways we can store and retrieve data.
- good quick intro to rrdtool
cuddletech
What is CDEF ?
Consolidation Functions take values from DEFs and perform calculations on them
As to change line colour by value
rrdtool.update
Documentacio
update command
El codi python per escriure dades es :
rrdtool.update ( rrd_filename, '{}:{}:{}:{}'.format(time_mark, pp, pc, pd) )
updatev :
This alternate version of update takes the same arguments and performs the same function.
The v stands for verbose, which describes the output returned.
updatev returns a list of any and all consolidated data points (CDPs) written to disk as a result of the invocation of update.
Compte que si fem :
rrdtool update ../dades/pkw.rrd N:530:-304:-225
Ens podem trobar amb :
<!-- 2022-05-12 19:14:20 CEST / 1652375660 --> <row><v>4.436556860e+02</v><v>-2.544742048e+02</v><v>-1.883443950e+02</v></row>
rrdtool.resize
Documentacio
resize command
RRD of 10080 rows was to contain 7 days of data at 1 sample per minute (60 samples per hour X 24 hours X 7 days)
To have 1 year of data at 1 sample every 5 secs, our size must be ... 12 samples per minute X 60 minutes per hour X 24 hour per day X 365 days per year =
So I did :
$ rrdtool resize pkw.rrd 0 GROW 6307200
... and got a 6317280 rows file (6307200 + 10080)
The syntax is rrdtool resize filename rra-num GROW|SHRINK rows
... where rows is the number of rows you want to add or remove.
The new .rrd file, with the modified RRAs, is written to the file resize.rrd in the current directory.
The original .rrd file is not modified.
rrdtool.graph
Documentacio
graph command
This command creates an image from the data in an RRD file.
rrdtool.graph ( png_filename,
'--imgformat', 'PNG',
'--width', '540',
'--height', '200',
'--start', "-{}".format(elapsed_secs),
'--slope-mode',
'--end', 'now',
'--title', title,
'--vertical-label', 'Potencia produida, consumida, resta {kW}',
'--lower-limit', '0',
'--alt-autoscale-max',
'COMMENT:"{%s} sag@tinet.cat%szTS"',
'DEF:Pprod={}:Pprod:MAX'.format(rrd_filename),
'DEF:Pcons={}:Pcons:MAX'.format(rrd_filename),
'DEF:Pdiff={}:Pdiff:MAX'.format(rrd_filename),
'LINE1:Pprod#ff0000:Pprod',
'LINE1:Pcons#0000ff:Pcons',
'LINE1:Pdiff#00ff00:Pdiff' )
rrdtool graph needs data to work with, so you must use one or more data definition statements to collect this data :
DEF:<vname>=<rrdfile>:<ds-name>:<CF>[:step=<step>][:start=<time>][:end=<time>][:reduce=<CF>][:daemon=<address>]
oss.oetiker
rrdtool.graph - tipus de grafica
Values of different variables can be presented in 5 different shapes in a graph - AREA, LINE1, LINE2, LINE3, and STACK.
AREA is represented by a solid colored area with values as the boundary of this area.
LINE1/2/3 (increasing width) are just plain lines representing the values.
STACK parameter for AREA and LINEx indicates to "stack" this element on top of previous AREA or LINE1/2/3.
Another important thing to note is that variables are plotted in the order they are defined in the graph command.
Therefore care must be taken to define STACK only after defining AREA/LINE. It is also possible to put formatted comments within the graph.
oss.oetiker
LINE[width]:value[#color][:[legend][:STACK]]
Draw a line of the specified width onto the graph.
width can be a floating point number.
If the color is not specified, the drawing is done 'invisibly'. This is useful when stacking something else on top of this line.
Also optional is the legend box and string which will be printed in the legend section if specified.
The value can be generated by DEF, VDEF, and CDEF.
If the optional STACK modifier is used, this line is stacked on top of the previous element which can be a LINE or an AREA.
When you do not specify a color, you cannot specify a legend.
Should you want to use STACK, use the ''LINEx:<value>::STACK'' form.
AREA:value[#color][:[legend][:STACK]]
See LINE, however the area between the x-axis and the line will be filled.
sis solucoes
graph,
RPN for DEF,
DEF, CDEF, VDEF,
rrdgraph overview
DEF:<vname>=<rrdfile>:<ds-name>:<CF>[:step=<step>][:start=<time>][:end=<time>][:reduce=<CF>]
my first graph (gracies, Albert !)
'DEF:Pdiff={}:Pdiff:MAX'.format(rrd_filename),
'AREA:Pdiff#00ff00:EntSal xarxa')
my graph in 2 colours
rrdtool graph out.png
DEF:x=foo.rrd:data:LAST
CDEF:n=x,DUP,0,LT,*
CDEF:p=x,DUP,0,GT,*
AREA:n#ff0000
AREA:p#00ff00
lists.oetiker.ch
rrdtool.graph URLs
Some URLs :
rrdtool.xport
Documentacio
xport command
The xport function's main purpose is to write an XML or JSON
formatted representation of the data stored in one or several RRDs.
rrdtool xport [-s|--start seconds] [-e|--end seconds]
[-m|--maxrows rows] [--step value]
[--json] produce json formatted output, instead of xml
[-t|--showtime] [--enumds] [--daemon|-d address]
[DEF:vname=rrd:ds-name:CF]
[CDEF:vname=rpn-expression]
[XPORT:vname[:legend]]
bash "rrdtool xport"
pi@R4:~/python/pkw/dades/2_proves_fetch $ cat 5_xport_curt.sh
#!/bin/bash
rrdtool xport \
--start now-1min --end now \
--step 5 --json -t \
DEF:xx=$1:Pprod:MAX \
XPORT:xx:"potencia produida darrer minut"
Funciona de maravella, quan poso eixos parametres de temps de inici i final :
pi@R4:~/python/pkw/dades/2_proves_fetch $ ./5_xport_curt.sh ../pkw.rrd
XPORT ( ../pkw.rrd ).
{ "about": "RRDtool graph JSON output",
"meta": {
"start": 1652973835,
"end": 1652973890,
"step": 5,
"legend": [
"potencia produida darrer minut"
]
},
"data": [
[ "1652973835",1.887985885e+03 ],
[ "1652973840",1.879296472e+03 ],
[ "1652973845",1.870487381e+03 ],
[ "1652973850",1.870487381e+03 ],
[ "1652973855",1.874519164e+03 ],
[ "1652973860",1.878304328e+03 ],
[ "1652973865",1.880383438e+03 ],
[ "1652973870",1.883492617e+03 ],
[ "1652973875",1.887882917e+03 ],
[ "1652973880",1.907257727e+03 ],
Malauradament, quan poso jo els "epoch" de començament i final, canvia el step i perdem dades :
./b_xport_2_parametres_epoch.sh -i 1652824800 -f 1652911195 # May 18, 2022 12:00:00 AM -> May 18, 2022 11:59:55 PM
{ "about": "RRDtool graph JSON output",
"meta": {
"start": 1652825185,
"end": 1652911400,
"step": 215, <<<<<<<< ????????
"legend": [
"potencia entre 2 epoch"
]
},
"data": [
[ "1652825185",0.000000000e+00 ],
[ "1652825400",0.000000000e+00 ],
[ "1652825615",0.000000000e+00 ],
[ "1652825830",0.000000000e+00 ],
Aixo passa quan hi ha "NaV" :
<!-- 2022-05-18 01:20:25 CEST / 1652829625 --> <row><v>0.000000000e+00</v><v>4.501546368e+02</v><v>-4.501546368e+02</v></row>
<!-- 2022-05-18 01:20:30 CEST / 1652829630 --> <row><v>NaN</v><v>NaN</v><v>NaN</v></row>
<!-- 2022-05-18 01:20:35 CEST / 1652829635 --> <row><v>NaN</v><v>NaN</v><v>NaN</v></row>
<!-- 2022-05-18 01:20:40 CEST / 1652829640 --> <row><v>NaN</v><v>NaN</v><v>NaN</v></row>
<!-- 2022-05-18 01:20:45 CEST / 1652829645 --> <row><v>NaN</v><v>NaN</v><v>NaN</v></row>
<!-- 2022-05-18 01:20:50 CEST / 1652829650 --> <row><v>NaN</v><v>NaN</v><v>NaN</v></row>
<!-- 2022-05-18 01:20:55 CEST / 1652829655 --> <row><v>0.000000000e+00</v><v>4.418130082e+02</v><v>-4.418130082e+02</v></row>
Aixi, descartem el fer servir "xport"
python "rrdtool.xport"
export command ,
pythonhosted
rrdtool.xport ( '--start', 'now-1min',
'--end', 'now',
'--step', '5',
'--json',
'-t',
'DEF:xx=../pkw.rrd:Pprod:MAX',
'XPORT:xx' )
... malauradament, no funciona, ... no treu res ...
issue 1179 {20220517}
rrdtool.fetch
Documentacio
fetch command
The fetch function will analyze the RRD and try to retrieve the data in the resolution requested.
The data fetched is printed to stdout.
rrdtool fetch filename CF [--resolution|-r resolution]
[--start|-s start] [--end|-e end]
[--align-start|-a] [--daemon|-d address]
filename = the name of the RRD you want to fetch the data from.
CF = the consolidation function that is applied to the data you want to fetch (AVERAGE,MIN,MAX,LAST)
bash "rrdtool fetch"
El codi es ben planer :
pi@R4:~/python/pkw/eines/analitzar_un_dia $ cat extreure_1_dia.sh
while getopts d:i:f:o: flag
do
case "${flag}" in
d) IFN=${OPTARG};;
i) eINI=${OPTARG};;
f) eFIN=${OPTARG};;
o) fnOUT=${OPTARG};;
esac
done
echo ">>> FETCH ($IFN), eStart ($eINI), eEnd ($eFIN), fnOut ($fnOUT)."
rrdtool fetch $IFN MAX -r 5 -s $eINI -e $eFIN > $fnOUT
Funciona perfectament :
pi@R4:~/python/pkw/eines/proves/3_proves_fetch $ ./1_fetch.sh
Pprod Pcons Pdiff
1652829615: 0.0000000000e+00 4.4389703260e+02 -4.4389703260e+02
1652829620: 0.0000000000e+00 4.4713282840e+02 -4.4713282840e+02
1652829625: 0.0000000000e+00 4.5015463680e+02 -4.5015463680e+02
1652829630: nan nan nan
1652829635: nan nan nan
1652829640: nan nan nan
1652829645: nan nan nan
1652829650: nan nan nan
1652829655: 0.0000000000e+00 4.4181300820e+02 -4.4181300820e+02
1652829660: 0.0000000000e+00 4.4431873200e+02 -4.4431873200e+02
python "rrdtool.fetch"
No acaba de rutllar :
pi@R4:~/python/pkw/eines/proves/3_proves_fetch $ cat 2_fetch_2_parametres_epoch.py
#!/usr/bin/env python
# -*- coding: UTF-8 -*-
import sys
import rrdtool
ifn = './pkw.rrd'
szStart = '1652775000'
szEnd = '1652775050'
numArg = len(sys.argv)
print ( 'Entrem amb (%i) parametres.' % numArg )
if ( numArg > 1 ) :
szStart = sys.argv[1]
if ( numArg > 2 ) :
szEnd = sys.argv[2]
print ( 'FETCH - RRD is (%s)' % ifn )
print ( 'FETCH - szStart is (%s)' % szStart )
print ( 'FETCH - szEnd is (%s)' % szEnd )
rrdtool.fetch ( ifn, "MAX",
'--resolution', '5',
'--start', szStart,
'--end', szEnd )
sys.exit()
No treu res, i no en se pas la rao.
rrdtool.dump
Documentacio
dump command
The dump function writes the contents of an RRD in human readable XML format to a file or to stdout.
This format can be read by rrdrestore.
rrdtool dump filename.rrd [filename.xml] [--header|-h {none,xsd,dtd}] [--no-header|-n] [--daemon|-d address] [> filename.xml]
epoch timestamp
rrdtool uses "unix" time : epoch -
every day is treated as if it contains exactly 86400 seconds
Here is a online epochconverter.com converter
Compte : 12am refers to midnight at the start of the specified day (00:00) and 12pm to midnight at the end of that day (24:00)
bash and epoch
Assuming you're using GNU coreutils (as both --date and the %s format string are GNU extensions), use
pi@R4:~$ date -d '12/31/2012 07:21:22' +"%s"
1339478482
pi@R4:~$ date -d "Oct 21 1973" +%s
120006000
stackOverflow
bash and epoch from shell file
#!/bin/bash
myVar=$(date -d '06/12/2012 07:21:22' +"%s")
echo $myVar
szStart='06/12/2021 00:00:00'
myVar=$(date -d "$szStart" +"%s")
echo $myVar
bash and epoch - convert seconds to date
Convert seconds since the epoch (1970-01-01 UTC) to a date :
pi@R4:~$ date --date='@2147483647'
python and epoch
pi@R4:~/python/pkw/dades/2_proves_fetch $ cat 4_epoch.py
#!/usr/bin/env python
# -*- coding: UTF-8 -*-
import time
import datetime
now = datetime.datetime.now()
szTime = now.strftime("%Y-%m-%d %H:%M:%S %Z")
iEpoch = time.time()
print ( 'iEpoch de ara mateix, (%s), since 1 January 1970, and using datetime.datetime,is (%i).' % (szTime, iEpoch ) )
# output : iEpoch de (2022-05-18 14:29:20), since 1 January 1970, is (1652876960).
ct = datetime.datetime.now()
iEpoch = time.mktime(ct.timetuple())
print ( 'iEpoch de ara mateix, using datetime.datetime.now, is (%i).' % iEpoch )
szTime = "date 2022 05 16 12:00:00"
myTS = time.strptime( szTime, "date %Y %m %d %H:%M:%S")
iEpoch = time.mktime( myTS )
print ( 'iEpoch de un string com (%s) es (%i).' % (szTime, iEpoch) ) # output 1652695200
"NaN" values
Sometimes rrdtool sets "NaN" values in the DB, as when a data is missing.
Any numerical operation will fail with this operand, so we have to replace it.
import numpy
import pandas as pd # pip install pandas (3 h)
def dada_fronius_a_integer ( dadaFronius ): # input a string
print( "type dada Fronius (%s) {%s}." % (type(dadaFronius), dadaFronius) )
# if numpy.isnan(value):
# value = numpy.nan_to_num(value) #
numpy doc
# if pd.isnull(dadaFronius): #
pandas doc
if ( dadaFronius == 'nan' ) :
iDada = int ( 0 )
else:
fDada = float ( dadaFronius )
iDada = int ( fDada )
return iDada
El meu crontab del R4
Comencem amb :
$ crontab -l
*/1 * * * * /home/pi/python/pkw/bin/pkw_cli.py dump >> /home/pi/python/pkw/logs/pkw_dump.log 2>&1
*/5 * * * * /home/pi/python/pkw/bin/pkw_cli.py graph >> /home/pi/python/pkw/logs/pkw_graph.log 2>&1
Agafar la potencia cada 5 segons -> RRDtool
Objectiu : fer grafiques maques.
{R4} cron to capture power every 5 seconds -> RRDtool
Cron job cannot be used to schedule a job in seconds interval, so you cannot schedule a cron job to run every 5 seconds.
The alternative is to write a shell script that uses ‘sleep 5’ command in it :
$ cat every-5-seconds.sh
#!/bin/bash
while true
do
/home/mypath/do_some_job.sh
sleep 5
done
We want to run this shell script forever since R4 start ...
pi@R4:~/.config/systemd/user $ cat fronius_poll.service
[Service]
Type=simple
; simple - a long-running process that does not background itself and stays attached to the shell
ExecStart=/home/pi/eines/fronius_poll.sh
.. i que acaba cridant a "/home/pi/python/pkw/bin/pkw_cli.py read_and_store" per escriure a la RRDB.
PKW a GITLAB
Acabarà aqui : gitlab.com/sebastia-net/pkw
Llegeixo
You can't push or pull repositories using SSH until you add an SSH key to your profile.
pi@R4:~/python/pkw $ ssh-keygen -t ed25519 -C "2022 gitlab"
Generating public/private ed25519 key pair.
Enter file in which to save the key (/home/pi/.ssh/id_ed25519):
Enter passphrase (empty for no passphrase): Sebas.2022
Enter same passphrase again:
Your identification has been saved in /home/pi/.ssh/id_ed25519.
Your public key has been saved in /home/pi/.ssh/id_ed25519.pub.
The key fingerprint is:
SHA256:E3N/xiueBipCNPr7E2cQoJuAePXSbndebqp6lnAR+X8 2022 gitlab
The key's randomart image is:
+--[ED25519 256]--+
| o. . |
|o o o. o |
|+ o . o.oo. |
| o ooo. .+.. . |
| oo .o.S...o + |
| . ..o.++.o.oE. |
| o * o..+.. |
| o o = +.o |
| .+o*....o |
+----[SHA256]-----+
Afegeixo id_ed25519.pub a https://gitlab.com/-/profile/keys/9621914
Tambe llegeixo
Your account is authenticated with SSO or SAML.
To push and pull over HTTPS with Git using this account, you must set a password or set up a Personal Access Token.
For more information, see Clone with HTTPS.
You can generate a personal access token for each application you use that needs access to the GitLab API.
url
PAT = glpat-SxmQdaw8uMM1cZDgwSYz
Verify :
pi@R4:~/.ssh $ ssh -Tvvv git@gitlab.com
The authenticity of host 'gitlab.com (172.65.251.78)' can't be established.
ECDSA key fingerprint is SHA256:HbW3g8zUjNSksFbqTiUWPWg2Bq1x8xdGUrliXFzSnUw.
Are you sure you want to continue connecting (yes/no)? yes
Warning: Permanently added 'gitlab.com,172.65.251.78' (ECDSA) to the list of known hosts.
Enter passphrase for key '/home/pi/.ssh/id_ed25519': *** {see up}
Welcome to GitLab, @sebastiasebas!
canvi d'any
El fitxer es fa força gran :
pi@R4:~/python/pkw/dades $ ls
147832 -rw-r--r-- 1 pi pi 151373980 Dec 29 12:47 pkw.rrd -->
- guardem el vell
pi@R4:~/python/pkw/dades/old_rrds $ mv ../pkw.rrd ./pkw_2025.rrd
- en fem un de nou, buid
pi@R4:~/python/pkw/bin $ ./pkw_cli.py initialize
Com fem per re-generar-lo ?
Les dades es graven aixi :
pi@R4:~ $ systemctl --user status fronius_poll.service
● fronius_poll.service - Raspberry 4 /home/pi/.config/systemd/user/fronius_poll.service - (v1.c)
Loaded: loaded (/home/pi/.config/systemd/user/fronius_poll.service; enabled; vendor preset: enabled)
Active: active (running) since Tue 2023-10-31 19:49:42 CET; 1 months 28 days ago
Main PID: 945 (fronius_poll.sh)
CGroup: /user.slice/user-1000.slice/user@1000.service/fronius_poll.service
├─ 945 /bin/bash /home/pi/eines/fronius_poll.sh
└─13284 sleep 5
Warning: Journal has been rotated since unit was started. Log output is incomplete or unavailable.
Que en detall ve a ser :
pi@R4:~ $ cat /home/pi/eines/fronius_poll.sh
while true
do
/home/pi/python/pkw/bin/pkw_cli.py read_and_store >> $myLogFile 2>&1
sleep 5
done
{R4} Agafar la potencia cada minut -> CSV
Objectius :
- verificar (i corregir si cal) la consistencis dels fitxers de dades - han de tenir 1440 mesures cada dia (1 mesura cada minut, 60 per hora)
- comparar amb Fronius APP
- fer alguna grafica
- calcular la factura, vist que sabem el preu del KW per cada hora
cron to capture power every minute -> CSV file
pi@R4:~ $ crontab -l
# PKW - guardar com a texte la energia del darrer minut, produida, consumida i la entrada/sortida de la xarxa .. en format CSV
*/1 * * * * /home/pi/python/pkw/eines/veure_potencia_instant/4_veure_potencia_instant_i_esciure_a_fitxer.py
-> /home/pi/python/pkw/dades/potencies/csv/pot_CSV_2022_05_25.csv
verificar i corregir consistencia de les dades
Entrada : /home/sebas/dades/python/pkw/dades/potencies/csv/
calcul energies diaries ds CSVs : Ep, Ec
Podem calcular la energia produida i la consumida mitjançant els nostres "CSV"
Entrada : potencies llegides cada minut (produccio, consum, diferencia)
Sortida : energia produida en un dia (Wh), consum en un dia (Wh)
pi@R4:~/python/pkw/eines/factura $ ./1_factura.py 2023/12/30
>>> Llegim CSV de (/home/pi/python/pkw/dades/potencies/csv/pot_CSV_2023_12_30.csv) a Array o List.
>>> Hem escrit CSV (1440) linies de (/home/pi/python/pkw/dades/potencies/csv/pot_CSV_2023_12_30.csv) a 4 Arrays o List.
>>> lst_Prod conte (1440) elements.
+++ En el periode {2023/12/30 00:00:00 .. 2023/12/30 23:59:55} - (1440/1440) minuts ...
+++ (1) Energia produida (8998) Wh.
+++ (2) Energia consumida (43283) Wh.
+++ (3) Energia de autoconsum (-2734) Wh.
+++ (4) Energia comprada (037102) Wh.
+++ (5) Energia venuda (002814) Wh.
*** (1) produida + (4) comprada == (2) consum + (5) venuda ***
*** in (46100) = out (46097)
El cert es que l'energia auto-consumida que calculo no em coincideix amb la mostrada a la APP del Android,
tot i tenir les 1440 linies (24 hores x 60 mostres per hora) al CSV.
També, a partir de les dades q agafem cada minut,
- /home/sebas/dades/python/pkw/dades/potencies/csv/pot_CSV_2023_12_27.csv from R4@/home/pi/python/pkw/dades/potencies/csv -
podem calcular la energia produida i consumida en un dia :
sebas@minie:~/dades/python/pkw/dades/potencies/csv$ scp pi@r4:/home/pi/python/pkw/dades/potencies/csv/pot_CSV_2024_04_*.csv . {agafar les dades de R4 ... al minie}
sebas@minie:~/dades/python/pkw/eines$ ./2_verify_N_files.py 4 2023_12_30
>>> calcul energies del fitxer ../dades/potencies/csv/pot_CSV_2023_12_30.csv
>>> energies del fitxer ../dades/potencies/csv/pot_CSV_2023_12_30.csv : Prod 8998 W, Cons -43282 W
... mentre que Fronius diu ...
2023:12:30 * 8,99 * 6,15 * 42,95 *
calcul factura
Els factors que intervenen son :
- sigui "P" la produccio de les plaques solars (sempre positiva)
- sigui "C" el consum de la casa (sempre negativa)
- sigui "D" la energia excedent que surt cap a la xarxa (positiva) o deficit que entra de la xarxa (negativa)
- sigui "A" el autoconsum,
- i "EV" la energia que venem i "EC" la energia que comprem
Els calculs interessants son :
- si "C<P", consumim menys que produim, es a dir, tenim excedent i estem venent energia a la xarxa (diff<0)
A = C
EV = P-C
- si "C>P", consumim mes del que produim, es a dir, estem comprant energia de la xarxa (diff>0)
A = P
EC = C-P
Ara ja tenim els valors a facturar :
- EV es lo que hem de cobrar, energia venuda
- EC es lo que hem de pagar, energia comprada
SAG - calculo una factura {up}
alguna grafica en background al MARS
El R4 va escrivint fitxers de texte amb dates de energia i potencia.
Al MARS podem fer alguna grafica en background, visualitzant valors diaris, setmanals o mensuals.
D'entrada, fem servir matplotlib
Gestio d'excedents
Gestors ja coneguts
Gestor d'excedents: si no es vol liar molt (molt) amb programació i Raspberrys i tal, hi ha alguns gestors ja fets.
Un de obert és el freeds.es.
Fa servir esp32 (SoC, System on Chip, incluye wifi y bluetooth) i
esp01 (monta la versión más sencilla del ESP8266, con un procesador de 32bits a 80 Mhz, con 1MB de memoria, y dispone de 2 pines GPIO, SPI, I2C y UART)
Software : https://github.com/pablozg/freeds/releases
Te un canal a Telegram
Fronius solarweb monitoring
To display, do :
- log into solarweb homepage using email
- click "Analisis" (2nd from left)
- click "Historial"
- under "equipos" select "Primo 5.0-1"
- under "canales" select "Corriente CC MPP1" and "Corriente CC MPP2",
or "Potencia MPP1" and "Potencia MPP2",
or "Tensión CC MPP1" and "Tensión CC MPP2" ...
- click "OK" and you'll get a nice graph
Comandes per veure MMP1 o MPP2
Seria interessant fer servir wireShark per veure les comandes que envia solarweb
per obtenir dades (tensio o corrent) de MPP1 o MPP2 ---> impossible snifejar de PC-A eltrafic entre PC-B i PC-C en una wifi
Fronius local console
Use it to open a wifi access point or display solar voltage and current
wifi access and Fronius configuration
On local console, do :
- select CONFIG
- select "Punto acceso a wifi"
- select "Activar ?" - mind it stops after 10 min
- on your device (PC or Android), disconnect "Mobile Data"
- now we must connect the PC (or Android) to wifi "Fronius_240.1234567" - the password is "12345678"
- open a browser on default IP address of the Datamanager Card (192.168.250.181)
- on right side, select "Ajustes" / "Settings"
- select "Modbus" and configure :
- TCP connection
- port 502
- string control address offset = 101
- Sunspec Model Type INT + SF
- also, activate "logging en horas nocturnas" to know your energy use by night
Note: make sure to turn on the Night Mode in the Display Settings on the Fronius inverter to keep it from going offline at night.
- select "Network" and click "Configure WLAN IP" :
- Get address := "static"
- IP = 192.168.1.229
- mask = 255.255.255.0
- GW = 192.168.1.1
- DNS = 8.8.8.8
- WLAN settings := "REDWIFI_RGQC_2.4G"
- click on top-right "✅"
reset Datamanager Card wizard
http://192.168.250.181/admincgi-bin/configRevert.cgi?scope=all
datamanager troubleshooting guide
Quan engegar els electrodomestics ?
El horario valle abarca desde las 00h a 08 h entre semana, y durante todo el día los fines de semana y festivos.
Horario llano : de lunes a viernes, por la mañana de 08h a 10h, por la tarde de 14h a 18h y por la noche de 22h a 00h.
Horario punta : de lunes a viernes no festivos, de 10 a 14h y de 18 a 22h.
| hora | DL | DM | DX | DJ | DV | DS | DM | tarifa | electrodomestics |
| 00-08 | .
| .
| .
| .
| .
| .
| .
| vall
| (2) aqui els engeguem si no ha de fer sol l'endemà
|
| 08-10 | .
| .
| .
| .
| .
| .
| .
| pla
| no hi ha sol
|
| 10-14 | .
| .
| .
| .
| .
| .
| .
| punta
| massa car
|
| 14-18 | .
| .
| .
| .
| .
| .
| .
| pla
| (1) aqui els engeguem si fa sol ara mateix
|
| 18-22 | .
| .
| .
| .
| .
| .
| .
| punta
| massa car
|
| 22-00 | .
| .
| .
| .
| .
| .
| .
| pla
| no hi ha sol
|
Aparells q consumeixen a casa
Els aparells electrics que tenim son :
aparell potencia energia consumida (cicle o any)
-------- --------- --------------------------------
termo Fagor M-200 ECO 2.400 W
rentadora Miele W 5840 2.100 W
secadora Miele T 8826 WP 1.400 W
url
rentavaixelles
Siemens SN25M883EU 0,93 kWh
nevera cuina
Bosch KGN39VIDA .
nevera baix
Beko CHA 28020 110 W 277 kWh/year
forn
Beko BIE22101X .
microones LG 800 W
plantxa DX1550 2.200 W
cafetera DeLonghi .
torradora .
fregidora de oli .
fregidora de aire 1.550 W
TV de baix, Samsung UE 55 JU 6500 170 W
url
TV dormitori, LG 32LV5500 70 W, 100 kWh/any
url
escalfa-tovalloles 120 - 1000 W
secador de cabell .
mantes electriques : 13.500 W
p0.1.rebedor 1.200 W - 6 A
p0.2.cuina 700 W - 4 A
p0.3.menjador 3.600 W - 18 A
p1.4.bany 700 W - 4 A
p1.5.dormitori 1.600 W - 8 A
p1.6.passadis 700 W - 4 A
p1.7.nicolau 1.400 W - 7 A
p1.8.irina 1.400 W - 7 A
p2.9.altell 2.200 W - 10 A
Consums a casa, 2021
El consum energetic de 2021 va ser :
Consum (kWh)
Gener 2.426
Febrer 1.765
Març 1.456
Abril 601
Maig 486
Juny 389
Juliol 396
Agost 397
Setembre 383
Octubre 434
Novembre 1.509
Desembre 2.585
--------
12.827 kWh
factures ENDESA
factura Agost 2022
energia produida cada dia
Vuelven los momentos técnicos con Fronius ! {2022}
- 8 septiembre: definir la correcta posición del Fronius Smart Meter
- 6 octubre: la comunicación entre Fronius GEN24 Plus y BYD Battery-Box Premium HVS/M
- 10 noviembre, 16 h: activar/desactivar límite de alimentación a red con inversores Fronius (“inyección 0”) -
unirse,
ver video,
pdf
- 30 noviembre, 16 h: conexión de 2 inversores Fronius en paralelo -
unirse,
ver video,
pdf
eventos 20220913
¿Tiene preguntas o comentarios sobre el seminario web? Póngase en contacto con
webinar2@fronius.com
Se pueden ver en diferido ?
Tact is the art of making a point without making an enemy