|
home /
infca /
mq /
mq_admin
(navigation links)
|
El cuerpo, en lances de amor, es parte indispensable del alma.
|
MQ Admin
What admin API to use
Use PCFs instead of MQAI bags
\\MQ\Eines\PCF_Inquiry_channel\ (pcf),
\\MQ\Eines\AMQSAILCH_display_channel_status\ (bags)
PCF header (MQCFH) structure - CMQCFC.H file
see
"./mq_api.htm#mqapi_def"
texte from mqseries.net "MQAI will be dropped"
Good admin scripts
You can find some samples (01*.cmd) at
- \\MQ\cluster\samples\
- \\MQ\eines\clustering_demo\
- \\MQ\eines\qm_resolution_sample\
- \\MQ\CMDS\<misc>
Veiem els detalls, per ordre lògic d'execució:
95_esborrar_gestor.cmd
@echo off
SET QMN=PEREQM
echo 95_esborrar_gestor.cmd - Esborrar el gestor de cues { %QMN% }. D'acord ?
pause
echo Aturar gestor %QMN%
endmqm -p %QMN%
echo Esborrar gestor %QMN%
dltmqm %QMN%
echo Gestors de cues que hi ha ara mateix :
dspmq
pause
91_crear_gestor.cmd
@echo off
SET QMN=PEREQM
echo 91_crear_gestor.cmd - Crear gestor %QMN% ?
pause
crtmqm -u DLQ %QMN%
echo Engegar gestor %QMN%
strmqm %QMN%
echo Gestors actuals:
dspmq
pause
02_crear_objectes_gestor.cmd
@echo off
SET QMN=PEREQM
echo 91_crear_gestor.cmd - Crear gestor %QMN% ?
pause
crtmqm -u DLQ %QMN%
echo Engegar gestor %QMN%
strmqm %QMN%
echo Gestors actuals:
dspmq
pause
11_engegar_listener.cmd
@echo off
SET QMN=PEREQM
echo 11_engegar_listener_gestor.cmd - activar el Listener del gestor %QMN%
echo START LISTENER ('mq_listener') | runmqsc %QMN%
echo A veure si s'ha engegat (2442)
netstat -an | find "2442"
pause
Aqui hi ha els equivalents de
Linux ...
Active Directory
Using
AD
See SysAdminGuide !
How to enable the OAM to talk to AD,
so that it can verify that AD has authenticated a given user and find out what ids it belongs to :
start
here
You can certainly configure AD to act as a user repository
so that the OAM knows that user A can PUT or GET from a given queue.
- mqjeff
MQ Explorer
Homepage.
MQ Explorer is included with an MQ server installation and is also available for download as
SupportPac MS0T, updated for v7.5.0.2
MQ V 5 fa servir PCF ;
MQ 6 uses Eclipse : Java.
Start it from Java : strmqcfg (dedicado a mi buen amigo Francisco)
El requeriment fa servir SYSTEM.ADMIN.COMMAND.QUEUE,
on esta escoltant el command server.
La resposta fa servir cues dinàmiques / ReplyToQ.
It will use SYSTEM.ADMIN.SVRCONN for any remote queue managers.
It will use a bindings connection for any local queue managers,
unless you explicitly add them as remote queue managers.
Do you know how to hide / display dynamic queues ?
Eclipse Workbench
Enable Eclipse workbench :
Window- Preferences - Explorer - Startup in an Eclipse workbench
Writing Java tests for your WebSphere MQ environment to use in MQ Explorer :
0512_lane ;
again.
Explorer workspace
Switch workspace options in MQ Explorer has been dropped from 7.1 and above
Still launch MQ explorer with a certain workspace by using the "-data" option, although doesn't seem to allow the creation of new workspaces.
If you want to do that, install a standalone copy of Eclipse 3.6 and install the MQExplorer plugins into that.
Wish-List
M'agradaria tenir a la dreta :
- 6 canals (de 3 gestors diferents)
- 8 cues (de 4 gestors diferents)
- 2 listeners (de 2 gestors diferents)
- 3 DLQs (de 3 gestors diferents)
Les seves icones s'han de poder moure per el canvas,
i haurien de mostrar el seu estat (canal/listener) o fondaria (cues).
See
GMT, graphic monit tool (own)
Standalone installation
- start setup.exe from C8471ML.zip (MQ Server), and choose Custom
- only Eclipse is required, 117 MB.
-
MS0T
Required definitions for administration
Ensure that you have satisfied the following requirements
before trying to use the MQ Explorer.
- A command server is running on every remotely administered queue manager.
- A suitable TCP/IP listener object must be running on every remote queue manager.
This can be the WebSphere MQ listener or, on UNIX systems, the inetd daemon.
- A server-connection channel,
by default named SYSTEM.ADMIN.SVRCONN,
exists on all remote queue managers.
You can create the channel using the following MQSC command:
DEFINE CHANNEL(SYSTEM.ADMIN.SVRCONN) CHLTYPE(SVRCONN) MCAUSER('mqexplor')
- The system queue, SYSTEM.MQEXPLORER.REPLY.MODEL, "TYPE(QMODEL)"
must exist.
url
Startup
<path_instalacion_MQ>\bin\strmqcfg.exe -d
The syntax of this command follows:
>>-strmqcfg--+------+--+------+----------------------><
'- -c -' '- -i -'
Optional parameters
-c
-clean is passed to Eclipse.
This causes Eclipse to delete any cached data used by the Eclipse runtime.
-i
-init is passed to Eclipse.
This causes Eclipse to discard configuration information used by the Eclipse runtime.
url
Sequence by JeffLowrey to fix local QM only accessible as remote
("-i", then "-c" - "i" does not start explorer, but cleans cache)
How does it access a Queue Manager ?
It will use SYSTEM.ADMIN.SVRCONN for any remote queue managers.
It will use a bindings connection for any local queue managers,
unless you explicitly add them as remote queue managers.
Configuration file
Remote queue managers are stored in XML file :
%APPDATA%\IBM\MQ Explorer\.metadata\.plugins\com.ibm.mq.explorer.ui\WMQ_Handles.xml
A ZIP file can be exported using :
select upper level "IBM WS MQ", right click and "Export MQ Explorer values..."
Reset
Delete the .metadata directory at
C:\Documents and Setting\<userid>\Application Data\IBM\MQ Explorer
Mind Application Data directory is HIDDEN !
Another procedure is
here:
- Open the WMQ Explorer instance exhibiting the issue (queue manager names are not listed under the Queue Managers folder)
- Right click on the top-level "IBM WebSphere MQ" tree not in the navigator panel, and select "Export MQ Explorer Settings..."
- Ensure all checkboxes are selected, and select a target filename to perform the export to.
- Re-exporting the configuration in this way will ensure that only valid metadata is written out to the resulting XML file.
- Exit WebSphere MQ Explorer
- Delete or rename the "workspace" folder that was supplied. This will cause the workspace to be recreated when WMQ Explorer is next started.
- Import the configuration file generated in step 3.
The full list of queue managers should now be visible under the MQ Explorer - Navigator tab for queue managers.
Customizing
url
Problems
Local QM showed Status as "Disconnected", and no queue neither channels were displayed :
Solution :
missing a PATH entry to "\Program Files\IBM\WebSphere MQ\java\lib".
Ensure "mqjbnd05 loaded:" comes up as YES in WebSphere MQ - Properties \ Configuration information \
LOCALE - Explorer language
The explorer is a fully NLS'd product,
so all languages are provided regardless of where you download the trial from.
If your local machine is set to have french as its main language
then the explorer will run in french.
As for making it run in another language without changing your whole machines locale,
you will need to find these two scripts:
runmqcfg.cmd
runmqcfg_rcp.cmd
which by default are installed in:
C:\Program Files\IBM\WebSphere MQ\bin
You only need to edit the one that is used (_rcp for rich client mode)
but probably safest to edit both of them.
In each file, find the line:
set AMQ_EXPLORER="%AMQECLIPSE%\eclipse"
and after that insert the line:
set AMQ_EXPLORER=%AMQ_EXPLORER% -nl en_US
Save the files and then launch the explorer using strmqcfg or the program icon as usual.
The locales are simply standard java locale notation;
a list of valid java locale's can be found here for those wishing to experiment:
URL
mq explorer language change in v 7.5
Edit MQExplorer.ini in <MQ75_Install>/bin and include:
.
-startup
../mqexplorer/eclipse/plugins/org.eclipse.equinox.launcher_1.1.1.R36x_v20101122_1400.jar
--launcher.library
../mqexplorer/eclipse/plugins/org.eclipse.equinox.launcher.win32.win32.x86_1.1.2.R36x_v20101222
-vm
../java/jre/bin
-vmargs
-Xmx512M
-Duser.language=en
JARs per MQ
File + Import + File System +
Project + Properties : Java Build Path + Libraries + "Add JARs" ;
C:\Program Files\IBM\WebSphere MQ\java\lib
Comparing MQexplorer to RUNMQSC
url
RUNMQSC can NOT do :
crtmqm, dltmqm, strmqm, endmqm.
Neither dspmqaut, dmpmqaut, setmqaut.
MQexplorer can NOT do :
RESET CLUSTER,
START CHINIT.
Configuration and Display Extension Plug-ins [MS0P]
MS0P = MQ Explorer - Configuration and Display Extension Plug-ins -
homepage
by Mark E Taylor
This SupportPac provides a mechanism to format Event messages and to aggregate the Statistics and Accounting reports generated by MQ.
Installation Instructions
Download the zip file and unzip it to a new directory.
Edit the MS0P.link file to point to this directory,
and move it into the "links" directory under your Eclipse installation. {\\MQ\MQExplorer\eclipse\plugins}
Or
- Download or copy the zip file into the eclipse directory under which the other WMQ plugins are located.
If you have installed WebSphere MQ in the default location, this will be "C:\Program Files\IBM\WebSphere MQ\eclipse"
- Unzip the file "in place". This will create the plugins\<events.stats> subdirectory.
- Restart MQ Explorer with "strmqcfg -c".
MQ v7.5 :
- download tool into \\$_MQ_SupportPacks\MS0P-events_and_statistics_plugins\ms0p
- go to c:\MQ\MQExplorer\eclipse\dropins and create "MS0P" directory
- unzip tool into "c:\MQ\MQExplorer\eclipse\dropins\MS0P"
- restart Eclipse and you shall see a new folder labeled "Administered Servers"
- see
video
- right-click on SYSTEM.ADMIN.TRACE.ACTIVITY.QUEUE object, and select "Format Activity Records"
Explorer extension using Eclipse plug-ins [MH01, gone at v7]
Extends the ability of the WebSphere MQ Explorer to examine the MQ configuration and look for potential problems and make recommendations.
Code here : "\\T430\MQ\Explorer_Plugins".
MQ Explorer v7 and up : right-click on Qmgr name, select "Tests" and then "Run Default Tests"
How to install MH01 :
- Click on 'Help' on the menu bar
- Select 'Software Updates' and click on 'Find and install...'
- Select 'Search for new features to install' and click 'Next'
- Click on 'New Local Site...' and browse to the location of the unzipped
SupportPac zip file contents.
- Tick the box next to the new WMQ Healthcheck entry in the site list, and
click 'Next'
- In the displayed list of available features to install, choose the
'WebSphere MQ Explorer Healthcheck' entry and click 'Next'
Supplied tests
- general tests
- qmgr names are different enough
- DLQ : must exist, must be empty, max msg length, persistent
- FFST : must not exist
- all qmgrs must be running
- default Tx queue : must exist
- cluster tests
- cluster can resolve qmgr names
- cluster-sender in "retrying" state
- cluster-sender or cluster-receiver has "cluster" attribute
- duplicated queue manager
- two full repositories
- different instances of a cluster queue must have same attributes
- queue tests
- queue names are different enough
- any queue has reached Max_Depth
- "base" attribute in "alias" queue does exist
- all queueus are get-enabled
- all queueus are put-enabled
- remote queue : verify rmt_qmgr, rmt_queue, xmit_queue
- channel tests
- channel names are different enough
- any channel is "in doubt"
- match channel pairs
- ping non-running channel IP's
- resolve and ping hosts in "Connection Name"
- disconnect interval must be > heartbeat interval
- "MCA User ID" must exist in SVRCONN channels
- Xmit queues : must be used and must be used only once
- listener tests
- listener names are different enough
- a port number must be used only once by multiple qmgrs
- triggering tests
- initiation queue must exist and be local, a process must have it open for input
- process names are different enough
- process must have an absolute path
- process must exist
- verify "Trigger data" ; channel must be found ;
- SSL tests
- highlight any channels which have a last-started time earlier than the last modification time of the SSL key repository, and which could therefore need refreshing
- highlight any channels that have not got the CipherSpec attribute set
- highlight any channels that have not got the Authetnication of Parties Initiating Connections (SSLCAUTH) attribute set to Required.
- checks the SSL Key Repository attribute of queue managers to see if a file can be found at that location.
- verify the SSL peer attributes used in channel definitions
Supplied tests
Eclipse Plugins
{mqjeff}
Writing Eclipse Plugins is an advanced topic not for the average MQ administrator.
The current trend with MQ Explorer is to make it more friendly to the average MQ administrator, and less friendly to the average Eclipse programmer.
For example, it's not possible to run MQ Explorer 7.1 in an Eclipse workbench without installing an Eclipse workbench.
There are a lot of complicated factors that contribute to this - including such basic things as the size of the default install!
It's assumed you a) know what you want to test, b) know how to write a program to test it.
First rule of dealing with MQExplorer plugins is that everything you want to do with a queue manager
has to be done using Java code that sends PCF messages.
So if you can't write Java code that sends the PCF messages you want to send,
and processes the responses you get back,
then you can't write an MQExplorer plugin - and consequently can't write an MQexplorer Test - since Tests are MQ Explorer plugins.
For the less experienced PCF programmer, I highly recommend PCF Escape messages.
Read-only Explorer
Using WebSphere MQ Explorer as a read-only viewer
Security concerns when using MQ Explorer for remote admin
Another MQ Eclipse Explorer
MisterQ, light-weight MQ explorer tool, plugin for the Eclipse platform.
PCFs commands
The purpose of WebSphere MQ programmable command format (PCF) commands
is to allow administration tasks to be programmed into an administration program.
In this way, from a program you can manipulate
queue manager objects (queues, process definitions, namelists, channels, client connection channels, listeners, services, and authentication information objects),
and even manipulate the queue managers themselves.
PCF commands cover the same range of functions provided by MQSC commands.
Each PCF command is a data structure that is embedded
in the application data part of a WebSphere MQ message.
Briefly, these are some of the things needed to create a PCF command message:
- Message descriptor
This is a standard WebSphere MQ message descriptor, in which:
- Message type (MsqType) is MQMT_REQUEST.
- Message format (Format) is MQFMT_ADMIN.
- Application data
Contains the PCF message including the PCF header, in which:
- The PCF message type (Type) specifies MQCFT_COMMAND.
- The command identifier specifies the command, for example, Change Queue (MQCMD_CHANGE_Q).
For a complete description of the PCF data structures and how to implement them,
see "WebSphere MQ Programmable Command Formats and Administration Interface", amqzac06.pdf
or
csqzac07.pdf
MQ v7 System Admin Guide, amqzag10.pdf, pg 54 o pg 67/605
MQCFH, the PCF header is described on page 474, amqzac06.pdf
PCFs instead of MQAI bags
Try to inquire a queue depth :
SYSTEM.ADMIN.COMMAND.QUEUE
Command server is listening at this queue :
display ql(SYSTEM.ADMIN.COMMAND.QUEUE)
IPPROCS(1)
Lets see the handle :
dis qstatus(SYSTEM.ADMIN.COMMAND.QUEUE) type(handle) all
2 : dis qstatus(SYSTEM.ADMIN.COMMAND.QUEUE) type(handle) all
AMQ8450: Display queue status details.
QUEUE(SYSTEM.ADMIN.COMMAND.QUEUE) TYPE(HANDLE)
APPLDESC(WebSphere MQ Command Server) APPLTAG(C:\MQ\bin\amqpcsea.exe)
APPLTYPE(SYSTEM) BROWSE(NO)
CHANNEL( ) CONNAME( )
ASTATE(NONE) HSTATE(ACTIVE)
INPUT(EXCL) INQUIRE(YES)
OUTPUT(NO) PID(4616)
QMURID(0.0) SET(NO)
TID(1)
URID(XA_FORMATID[] XA_GTRID[] XA_BQUAL[])
URTYPE(QMGR)
We can stop the command server to see the message format using ENDMQCSV command
What is the format of the message to put ?
See MQ_v7_PCF_and_AI_csqzac06.pdf, PCF and AI
C sample to inquiry
command server
\\MQ\Eines\PCF_Inquiry_qmgr_Queues
Ask for any
value,
as MQIACH_BYTES_SENT and/or MQIACH_BYTES_RCVD
\\MQ\Eines\PCF_Inquiry_channel
PCF format
Commands and responses have the form:
You can look for "Command" in CMQCFC.H file
struct tagMQCFH {
MQLONG Type; /* Structure type */
MQLONG StrucLength; /* Structure length */
MQLONG Version; /* Structure version number */
MQLONG Command; /* Command identifier */
MQLONG MsgSeqNumber; /* Message sequence number */
MQLONG Control; /* Control options */
MQLONG CompCode; /* Completion code */
MQLONG Reason; /* Reason code qualifying completion code */
MQLONG ParameterCount; /* Count of parameter structures */
};
The types are
/* Types of Structure */
#define MQCFT_NONE 0
#define MQCFT_COMMAND 1
#define MQCFT_RESPONSE 2
#define MQCFT_INTEGER 3
#define MQCFT_STRING 4
And some values are
//
#define MQCMD_CHANGE_Q 8
#define MQCMD_INQUIRE_Q 13
Accessing the
MQCFH header
and the
MQCFH parser
See
response decoding
Access MQ from MB
Use "SYSTEM.ADMIN.COMMAND.QUEUE" to send commands to Command Server.
RUNMQSC
runmqsc [-e] [-v] [-w WaitTime] [-x] [QmgrName]
-e prevents source text for commands from being copied into a report.
-v specifies verification mode (available only locally).
-w specifies indirect mode. [2]
Required channel and queues must exist :
XMITQ = target.queue.manager [1]
source.to.target channel [1]
SYSTEM.ADMIN.COMMAND.QUEUE (target.queue.manager) [1]
XMITQ = source.queue.manager [1]
target.to.source channel [1]
SYSTEM.MQSC.REPLY.QUEUE (source.queue.manager) [1]
-x target QM is running under MVS/ESA (indirect mode)
[1] page 71, mq v 6.0 system admin guide
[2] conecta con el gestor por defecto
You can invoke the runmqsc command in 3 modes :
- verify mode - available only on a local qm.
- direct mode - commands sent directly to a local qm
- indirect mode - commands are run on a remote queue manager.
Indirect mode of operation is performed
through the default queue manager
The object source.queue.manager
is the source queue manager
from which you can issue MQSC commands
and to which the results of these commands (operator messages) are returned.
The object target.queue.manager is the name of the target queue manager,
which processes the commands and generates any operator messages.
If you are using runmqsc with the -w option,
source.queue.manager must be the default queue manager.
runmqsc -w 30 target.queue.manager
RUNMQSC is an utility that lets you view the queue manager objects
and their attributes.
It launches an interactive (command-line interface) administration session.
If input is from Script file, and an output is written to a status file, the syntax is :
RUNMQSC QmgrName { < InputFile } { > OutputFile }
Complete details in
MQSC Command Reference,
SC34-6055-02
implementation
Each command is sent as an Escape PCF to the command queue (SYSTEM.ADMIN.COMMAND.QUEUE) of the target queue manager.
The replies are received on queue SYSTEM.MQSC.REPLY.QUEUE and the outcome is added to the report.
This can be defined as either a local queue or a model queue.
syntax
ALTER
CLEAR
DEFINE
DISPLAY
END
PING
REFRESH CLUSTER
SECURITY
RESET CHANNEL [1] { AMQ 9526 - sequence }
CLUSTER
QMGR
RESOLVE CHANNEL(ch-name) ACTION( COMMIT | BACKOUT ) - SDR/SVR/CLUSSDR only
RESUME
START
STOP
SUSPEND
[1] RESET CHANNEL
If the command is issued to a sender or server channel,
then in addition to resetting the value at the end at which the command is issued,
the value at the other (receiver or requester) end is also reset to the same value
the next time this channel is initiated (and resynchronized if necessary).
If the command is issued
to a receiver, requester, or cluster-receiver channel,
the value at the other end is not reset as well;
this must be done separately if necessary.
MQ v 6.0 MQSC command reference,
SC34-6597-00,
csqzaj10.pdf,
pagina 397 [417/501]
[2] RESOLVE CHANNEL
This command is used when the other end of a link
fails during the confirmation period,
and for some reason it is not possible to reestablish the connection.
In this situation the sending end remains in doubt,
as to whether or not the messages were received.
Any outstanding units of work need to be resolved
by being backed out or committed.
Care must be exercised in the use of this command.
If the resolution specified is not the same
as the resolution at the receiving end,
messages can be lost or duplicated.
Page 409, MQ v 6.0, "MQSC Command Reference", SC34-6597-00
Remote administration from a local qmgr
runmqsc is the command-line tool typically used to adminster local queue managers.
You can also use runmqsc -w to administer remote queue managers.
You need a (default) queue manager on your local workstation
so that runmqsc can use it to collect MQSC commands and send them on to the command queues of your remote queue managers.
This lets you do all of your runmqsc administration work from a single point.
Note that your local queue manager will need channels going to and from the remote queue managers that you want to administer,
to allow the commands to be sent and the replies returned.
boulder
Now runmqsc has -m flag to indicate the local queue manager used to send commands to another queue manager
MQSC client, MO72
MO72 allows the use of MQSC commands either directly connected to a queue manager, or via a client connection to the queue manager.
The product-provided replacement for MO72 in MQ V8 is to use runmqsc with the "-n" option.
See
KC
MQSC in VCS
Install a version control system.
At midnight, run a script to do the following:
- run dmpmqcfg outputting the objects in 1 line
- run a REXX script to exclude 'SYSTEM.' objects
- check the resulting file into the version control system
I had a REXX script that separated the objects by type. i.e. QMGR, QLOCAL, QMODEL, etc.
I used the file name format of {QMgr}.{ObjectType}.mqsc and these files are what was checked into the version control system.
I'm a developer, so I always looked at the MQSC files as code and runmqsc as the run-time compiler.
So, checking the MQSC files into a version control system just made logically sense.
DISPLAY QMGR ALL
display qmgr all
1 : display qmgr all
AMQ8408: Display Queue Manager details.
QMNAME(FEM49P01) ACCTCONO(DISABLED)
ACCTINT(1800) ACCTMQI(OFF)
ACCTQ(OFF) ACTIVREC(MSG)
ALTDATE(2006-08-02) ALTTIME(12.09.06)
AUTHOREV(DISABLED) CCSID(1051)
CHAD(DISABLED) CHADEV(DISABLED)
CHADEXIT( ) CHLEV(DISABLED)
CLWLDATA( ) CLWLEXIT( )
CLWLLEN(100) CLWLMRUC(999999999)
CLWLUSEQ(LOCAL) CMDLEVEL(600)
COMMANDQ(SYSTEM.ADMIN.COMMAND.QUEUE) CRDATE(2006-08-02)
CRTIME(12.09.06) DEADQ(DLQ)
DEFXMITQ( ) DESCR( )
DISTL(YES) INHIBTEV(DISABLED)
IPADDRV(IPV4) LOCALEV(DISABLED)
LOGGEREV(DISABLED) MAXHANDS(256)
MAXMSGL(4194304) MAXPRTY(9)
MAXUMSGS(10000) MONACLS(QMGR)
MONCHL(OFF) MONQ(OFF)
PERFMEV(DISABLED) PLATFORM(UNIX)
QMID(FEM49P01_2006-08-02_12.09.06) REMOTEEV(DISABLED)
REPOS( ) REPOSNL( )
ROUTEREC(MSG) SCHINIT(QMGR)
SCMDSERV(QMGR) SSLCRLNL( )
SSLCRYP( ) SSLEV(DISABLED)
SSLFIPS(NO) SSLKEYR(/var/mqm/qmgrs/QMN1/ssl/key)
SSLRKEYC(0) STATACLS(QMGR)
STATCHL(OFF) STATINT(1800)
STATMQI(OFF) STATQ(OFF)
STRSTPEV(ENABLED) SYNCPT
TRIGINT(999999999)
SaveQmgr and change control
Homepage, MS-03.
[wbrkadm@dmqb261]:/MQHA/cfg/SaveRestoreMQ/fitxers> saveqmgrc.aix -h
Usage is:
saveqmgrc.aix [options], where [options] are one or more of the following optional switches
-h | -? : gives help (this)
-v version : determines which version of MQSC to generate
and can be '2','5','51','52','53' or '6'
The default is to generate mqsc at the version of the connected queue manager
Note: see read.me for more information on this flag
-m lqmgr : is the name of the local qmgr to connect (MQCONN)
-r rqmgr : is the name of the remote qmgr (XMITQ name)
-f [file] : allows the output file to be named,
if -f is not specified, the output file defaults to SAVEQMGR.TST
if -f is specified without a filename, it is named <qmgrname>.MQS
-o : specifies to replace (overwrite) the output file
if the -o flag is not specified, then the default is to append if the file exists
(on iSeries, *REPLACE,*APPEND must be specified after the -o flag)
-F [file] : behaves the same as -f except no header line is created in the output file
(and CURDEPTH, ALTDATE and ALTTIME are not reported)
-c : directs output to STDOUT and overrides use of -f flag
-s : suppress creation of objects that begin with "SYSTEM*", system objects.
-R : create RESET CHANNEL commands for non-client/svrconn channels
-p : Create 'local queue' definitions from PERMDYN queues.
-i : Ignore 'pcf' error codes 'damaged object' 'unknown object'.
Sets RetCode to WARNING if this error encountered.
-q : Quiet mode, do not issue warning about unknown PCF attributes
-1 : generate entire DEFINE command on one line (which does NOT include ALTDATE etc)
-2 : on a 2nd line, generate the DEFINE as a comment (which DOES include ALTDATE etc)
If either the -a or -x switch is used, then MQCONNX will be used for the client connection
-a host : is the address of the host for a client connection (default is "localhost")
-x channel : is the SVRCONN name for a client connection (default is SYSTEM.DEF.SVRCONN)
-C cipher spec : indicates to use an SSL cipher spec for this client connection
-k key repository : name of key respository directory if using SSL for client connection
-eX channel exit : X = 'y' for security, 's' for send, 'r' for receive
-dX "channel exit data": X = 'y' for security, 's' for send, 'r' for receive.
SAVEQMGR V6.0.2
Mind SYSTEM.DEF.SVRCONN
has to have mcauser=mqm (temporarily).
Otherwise
MQCONN failed for MQPRD01, CC=2 RC=2035
We recently implemented
MQDocument
at my shop.
Every morning when my MS03 batch job runs to back up every QM in the system,
it calls out to MQDocument to compare today's MS03 for each QM to yesterday's MS03s.
It then produces a little report that gets emailed to me listing what if anything got added,
deleted or changed on each QM.
Plus it keeps a rolling 90 days of these reports.
Gotta say that was the best money spent.
Careful as people are, stuff happens.
Scanning that report every morning has allowed me to catch some things
that would eventually become big and hairy problems.
SET AUTHREC versus setmqaut
We'll have to run MS03 and dmpmqcfg in parallel for now.
The dmpmqcfg command will capture the MQ 7.1/7.5 specific things like CHLAUTH records that MS03 does not.
MS03 will insure we get all authority records.
Approaches to monitoring MQ
There are various approaches to
monitoring WebSphere MQ.
Each approach is applied and used in a different way, and each approach returns monitoring information in a different form.
Depending on how you intend to monitor your MQ system you will use one, or a combination of, the following approaches:
- Event monitoring
- Message monitoring
- Accounting and statistics message
- Real-time monitoring

Event queues
You can define event queues either as local queues,
alias queues, or as local definitions of remote queues.
If you define all your event queues
as local definitions of the same remote queue on one queue manager,
you can centralize your monitoring activities.
Event queues
Controlling real-time monitoring
Real-time monitoring can be enabled or disabled
for individual queues or channels,
or for multiple queue or channels.
To control individual queues or channels,
the queue attribute MONQ, or the channel attribute MONCHL,
must be set to enable or disable real-time monitoring.
To control many queues or channels together,
real-time monitoring can be enabled or disabled
at the queue manager level
using the queue manager attributes MONQ and MONCHL.
For all queue and channel objects
whose monitoring attribute is specified with the default value, QMGR,
real-time monitoring is controlled at the queue manager level.
Automatically defined cluster-sender channels are not WebSphere MQ objects,
so do not have attributes in the same way as channel objects.
To control automatically defined cluster-sender channels,
use the queue manager attribute, MONACLS.
This attribute determines whether
automatically defined cluster-sender channels
within a queue manager
are enabled or disabled for channel monitoring.
To enable both queue and channel monitoring for all queues and channels at
the queue manager level, use the following commands:
ALTER QMGR MONQ(MEDIUM) MONCHL(MEDIUM)
ALTER QL(Q1) MONQ(QMGR)
ALTER CHL(QM1.TO.QM2) CHLTYPE(SDR) MONCHL(QMGR)
To control the monitoring capabilities
of automatically defined cluster-sender channels
use the following command:
ALTER QMGR MONACLS(MEDIUM)
To display the monitoring fields collected for this queue,
use the following command:
DISPLAY QSTATUS(Q1) MONITOR
To display the monitoring fields collected for this sender channel,
use the following command:
DISPLAY CHSTATUS(QM1.TO.QM2) MONITOR
To discover which cluster channel
is having problems delivering messages, issue :
DIS CHSTATUS(*) WHERE(XQMSGSA GT 1)
MQ v 6 Monitoring, chapter 18.
URL
Event Monitoring
When an event occurs, the queue manager puts an event message on the
appropriate event queue, if defined.
The event message contains information about the event.
Event Monitoring, SC34-6069-02.
Event Types
MQ instrumentation events come in the following types :
- queue manager events - events related to the definitions of resources within queue managers.
Eg.- an application tries to put a message to a queue that does not exist
- channel and bridge events - events reported as a result of conditions detected during their operation.
Eg.- a channel instance is stopped
- performance events - notifications that a threshold condition has been reached by a resource.
Eg.- a queue depth limit has been reached
- logger events - notifications that the queue manager has started writing a new log extent (qm that use linear logging only)
Monitoring, SC34-6593, page 33/411.
Queue manager events [SYSTEM.ADMIN.QMGR.EVENT]
- authority events [AUTHOREV]
- inhibit events [INHIBITEV]
- local events [LOCALEV]
- remote events [REMOTEEV]
- start and stop events [STRSTPEV]
Channel and Bridge events [SYSTEM.ADMIN.CHANNEL.EVENT]
- channel events [CHLEV]
- IMS Bridge events [BRIDGEEV]
- SSL events [SSLEV]
- Channel auto-definition events [CHADEV]
Queues used for events
 This event queue:            Contains messages from:       As
---------------------------- -------------------------     ----------------
 SYSTEM.ADMIN.QMGR.EVENT      Queue manager events          Not Authorized
 SYSTEM.ADMIN.CHANNEL.EVENT   Channel events                Channel stopped
 SYSTEM.ADMIN.PERFM.EVENT     Performance events            Queue full
 SYSTEM.ADMIN.CONFIG.EVENT    Configuration events          Change object
 SYSTEM.ADMIN.LOGGER.EVENT    Logger events                 New log extent
| Type of Event | How to Enable it | Queue to be used
|
| qmgr + authority events | ALTER QMGR AUTHOREV (ENABLED) | SYSTEM.ADMIN.QMGR.EVENT
|
| channel + autodefinition events | ALTER QMGR CHADEV (ENABLED) | SYSTEM.ADMIN.CHANNEL.EVENT
|
| channel + channel events | ALTER QMGR CHLEV (EXCEPTION) | SYSTEM.ADMIN.CHANNEL.EVENT
|
| qmgr + inhibit events | ALTER QMGR INHIBTEV (ENABLED) | SYSTEM.ADMIN.QMGR.EVENT
|
| qmgr + local events | ALTER QMGR LOCALEV (ENABLED) | SYSTEM.ADMIN.QMGR.EVENT
|
| logger events | ALTER QMGR LOGGEREV(ENABLED) | SYSTEM.ADMIN.LOGGER.EVENT
|
| performance events | ALTER QMGR PERFMEV (ENABLED) | SYSTEM.ADMIN.PERFM.EVENT
|
| qmgr + remote events | ALTER QMGR REMOTEEV (ENABLED) | SYSTEM.ADMIN.QMGR.EVENT
|
| channel + SSL events | ALTER QMGR SSLEV (ENABLED) | SYSTEM.ADMIN.CHANNEL.EVENT
|
| qmgr + start/stop events | ALTER QMGR STRSTPEV (ENABLED) | SYSTEM.ADMIN.QMGR.EVENT
|
| configuration events | ALTER QMGR CONFIGEV (ENABLED) | (zOS only)
|
| command events | ALTER QMGR CMDEV (ENABLED) | (zOS only)
|
Monitoring MQ
cmqc.h
#define MQIA_Q_DEPTH_MAX_EVENT 42 x2A
#define MQIA_Q_DEPTH_HIGH_EVENT 43 x2B
#define MQIA_Q_DEPTH_LOW_EVENT 44 x2C
#define MQIA_Q_SERVICE_INTERVAL_EVENT 46 x2E
#define MQIA_AUTHORITY_EVENT 47 x2F
#define MQIA_INHIBIT_EVENT 48 x30
#define MQIA_LOCAL_EVENT 49 x31
#define MQIA_REMOTE_EVENT 50 x32
#define MQIA_CONFIGURATION_EVENT 51 x33
#define MQIA_START_STOP_EVENT 52 x34
#define MQIA_PERFORMANCE_EVENT 53 x35
#define MQIA_CHANNEL_AUTO_DEF_EVENT 56 x38
#define MQIA_CHANNEL_EVENT 73 x49
#define MQIA_BRIDGE_EVENT 74 x4A
#define MQIA_SSL_EVENT 75 x4B
#define MQIA_LOGGER_EVENT 94 x5E
#define MQIA_COMMAND_EVENT 99 x63
Configuration Monitoring
Configuration events are reported when objects are created, or modified.
The event messages for configuration events are put on the SYSTEM.ADMIN.CONFIG.EVENT queue.
Configuration events are available on WebSphere MQ for z/OS only.
Monitoring MQ
How to enable Security Events ?
???
(manual) Q depth monitoring
Using MQAI (from AMQSAILQ.C):
// set queue name
mqAddString( adminBag, MQCA_Q_NAME, MQBL_NULL_TERMINATED, "*", &compCode, &reason ) ;
// set queue type
mqAddInteger( adminBag, MQIA_Q_TYPE, MQQT_LOCAL, &compCode, &reason ) ;
// set what we want to are inquire
mqAddInquiry( adminBag, MQIA_CURRENT_Q_DEPTH, &compCode, &reason ) ;
// send request
mqExecute( hConn, MQCMD_INQUIRE_Q, ...
Using PCF (from PCFMessageListQueueDepth.java, MS0B) :
// Connect a PCFAgent to the specified queue manager
agent = new PCFMessageAgent ( args [0] ) ;
// Build the request
request = new PCFMessage ( CMQCFC.MQCMD_INQUIRE_Q ) ;
request.addParameter ( CMQC.MQCA_Q_NAME, "*" ) ;
request.addParameter ( CMQC.MQIA_Q_TYPE, CMQC.MQQT_LOCAL ) ;
request.addParameter ( CMQCFC.MQIACF_Q_ATTRS, new int [] { CMQC.MQCA_Q_NAME, CMQC.MQIA_CURRENT_Q_DEPTH } ) ;
// Use the agent to send the request
System.out.print ( "Sending PCF request... ") ;
responses = agent.send ( request ) ;
System.out.println ( "Received reply." ) ;
// Display the results
for ( int i = 0 ; i < responses.length ; i++ )
{
String name = responses [i].getStringParameterValue ( CMQC.MQCA_Q_NAME ) ;
int depth = responses [i].getIntParameterValue ( CMQC.MQIA_CURRENT_Q_DEPTH ) ;
System.out.println ( "Queue " + name + " curdepth " + depth ) ;
}
// Disconnect
System.out.print ("Disconnecting... ");
agent.disconnect ();
From
StackOverflow :
// get a qmgr connection
// Create PCF Message Agent
try {
pcfAgent = new PCFMessageAgent( qmgr ) ;
} catch ( MQException mqe ) {
System.err.println( "PCF Message Agent creation ended with reason code " + mqe.reasonCode ) ;
return mqe.reasonCode ;
}
// Prepare PCF command to inquire queue status (status type)
inquireQueueStatus = new PCFMessage( CMQCFC.MQCMD_INQUIRE_Q_STATUS ) ;
inquireQueueStatus.addParameter( CMQC.MQCA_Q_NAME, "name of queue to inquire" ) ;
inquireQueueStatus.addParameter( CMQCFC.MQIACF_Q_STATUS_TYPE, CMQCFC.MQIACF_Q_STATUS ) ;
inquireQueueStatus.addParameter( CMQCFC.MQIACF_Q_STATUS_ATTRS, new int[] {
CMQC.MQCA_Q_NAME, CMQC.MQIA_CURRENT_Q_DEPTH,
CMQCFC.MQCACF_LAST_GET_DATE, CMQCFC.MQCACF_LAST_GET_TIME,
CMQCFC.MQCACF_LAST_PUT_DATE, CMQCFC.MQCACF_LAST_PUT_TIME,
CMQCFC.MQIACF_OLDEST_MSG_AGE, CMQC.MQIA_OPEN_INPUT_COUNT,
CMQC.MQIA_OPEN_OUTPUT_COUNT, CMQCFC.MQIACF_UNCOMMITTED_MSGS } ) ;
// retrieve the parms using:
pcfResp = pcfAgent.send(inquireQueueStatus);
// For each individual parm you can use the getXXXXXParameterValue method (XXXXXX is the type of data)
// For the Enq/Deq counts, you need to reset the queue statistics:
// Prepare PCF command to reset queue statistics
queueResetStats = new PCFMessage( CMQCFC.MQCMD_RESET_Q_STATS ) ;
queueResetStats.addParameter( CMQC.MQCA_Q_NAME, queueName ) ;
pcfResp3 = pcfAgent.send( queueResetStats ) ;
queueMsgDeqCount = pcfResp3[0].getIntParameterValue(CMQC.MQIA_MSG_DEQ_COUNT);
queueMsgEnqCount = pcfResp3[0].getIntParameterValue(CMQC.MQIA_MSG_ENQ_COUNT);
From MQseries.net, by Nacho (gracias, campeon)
{ from \\MQ\tools\pcf\samples\PCF_WalkThroughQueueManagerAttributes.java } :
url
try {
PCFMessageAgent agent = new PCFMessageAgent(ipaddr, 1414, "SYSTEM.ADMIN.SVRCONN");
int[] pcfParmAttrs = { com.ibm.mq.constants.CMQCFC.MQIACF_ALL } ;
PCFParameter[] pcfParameters = { new MQCFIL(com.ibm.mq.constants.CMQCFC.MQIACF_Q_MGR_ATTRS, pcfParmAttrs) } ;
MQMessage [] responses = agent.send( com.ibm.mq.constants.CMQCFC.MQCMD_INQUIRE_Q_MGR, pcfParameters ) ;
MQCFH mqCFH = new MQCFH( responses[0] );
PCFParameter pcfParam;
if ( mqCFH.getReason() == 0 ) {
for ( int index = 0; index < mqCFH.getParameterCount(); index++ ) {
// Walk through the returned attributes.
pcfParam = PCFParameter.nextParameter( responses[0] ) ;
System.out.println( pcfParam.getParameterName() ) ;
System.out.println( pcfParam.getValue() ) ;
}
}
}
catch (PCFException pcfe)
{ System.err.println ("PCF error: " + pcfe); }
catch (MQException mqe)
{ System.err.println (mqe); }
catch (IOException ioe)
{ System.err.println (ioe); }
See latest code
here.
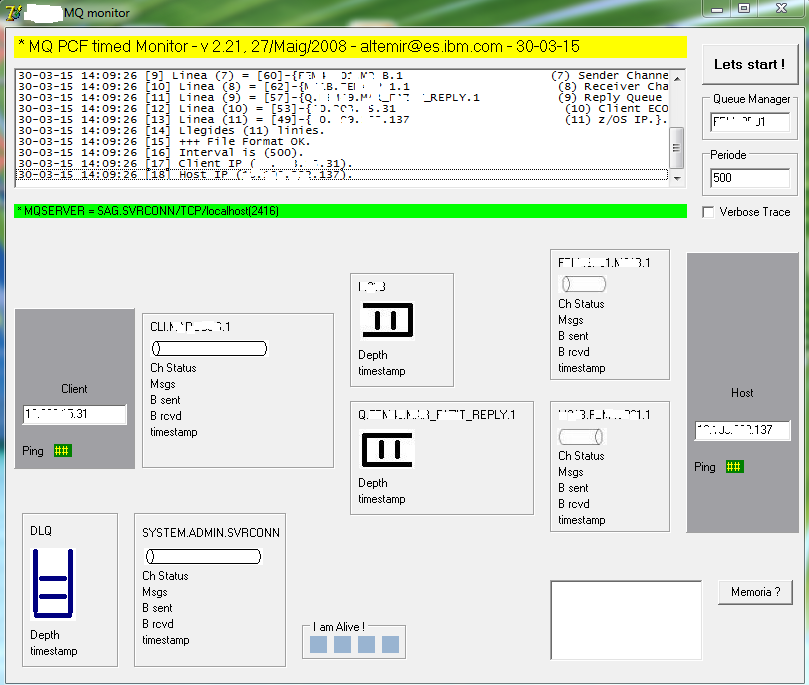
Let's write a (Delphi) program to display a queue depth every specific period.
Qmgr : \\MQ\CMDs\SMQ
Delphi code : \\Delphi\MQ\Monitor_Cua
Q High Depth Event monitoring
Performance Event (Event Tab) Enabled
SYSTEM.ADMIN.PERFM.EVENT
Monitoring, SC34-6593
MQFMT = MQEVENT
MS0P {Mark Taylor, 2012, mq v 7.0.1}
Delphi - monitor q depth uses MQINQ() with "Select [0] := MQIA_CURRENT_Q_DEPTH ;"
ALTER QMGR PERFMEV(ENABLED) // enable performace events
DEFINE QLOCAL(QL1)
ALTER QLOCAL(QL1) +
MAXDEPTH(10) + // the maximum number of messages allowed on the queue
QDPMAXEV(DISABLED) + // controls whether Queue Full events are generated
QDEPTHHI(80) + // the threshold against which the queue depth is compared to generate a Queue Depth High event - % of MAXDEPTH !
QDPHIEV(ENABLED) + // controls whether Queue Depth High events are generated
QDEPTHLO(20) + // Queue Depth Low event generation threshold - % of MAXDEPTH !
QDPLOEV(DISABLED) // controls whether Queue Depth Low events are generated
Atencio :
QDEPTHHI(integer)
The threshold against which the queue depth is compared to generate a Queue Depth High event.
This parameter is supported only on local and model queues.
For more information about the effect that shared queues on z/OS have on this event, see the Monitoring WebSphere MQ book.
This event indicates that an application has put a message on a queue,
and this has caused the number of messages on the queue to become greater than or equal to the queue depth high threshold.
See the QDPHIEV parameter.
The value is expressed as a percentage of the maximum queue depth (MAXDEPTH parameter),
and must be greater than or equal to zero, and less than or equal to 100.
Enabling Queue Full events
When enabled,
a Queue Full event is generated when an application is unable to put a message onto a queue because the queue is full.
To enable Queue Full events on the queue MYQUEUE, use the following MQSC commands:
ALTER QMGR PERFMEV(ENABLED)
ALTER QLOCAL('MYQUEUE') QDPMAXEV(ENABLED)
Automatically enabling events :
-
a "Queue Full" event is automatically enabled
by a "Queue Depth High" or a "Queue Depth Low" event on the same queue
-
a "Queue Full" event automatically enables a "Queue Depth Low" event on the same queue
MQ v 6.0 Monitoring, page 36 [58/411].
queue high event message
Sample code is here : \\T430\MQ\Events\queue_full
Argument (1) = (\\MQ\Eines\EventMonitor\EvMo.exe).
Argument (2) = (SMQ).
Argument (3) = (SYSTEM.ADMIN.PERFM.EVENT).
>>> MQ Connect to [SMQ].
+-+ MQ Connect CC [0], RC [0].
>>> MQ Open on object [SYSTEM.ADMIN.PERFM.EVENT] with options [x'2009'].
+-+ MQ Open CC [0], RC [0].
... wait for event message ... >
...get the event message ... >
Sat Feb 08 18:11:30 2014
DataLength = [236].
Performance event:
CompCode(WARNING)
Reason = [MQRC_Q_DEPTH_HIGH].
Parameter count is [6].
{MQCA_Q_MGR_NAME} [SMQ ].
{MQCA_BASE_Q_NAME} [QL1 ].
Print FMQCF Integer, parameter is [35, 0x23].
MQIA_TIME_SINCE_RESET [90]. (X'5A').
Print FMQCF Integer, parameter is [36, 0x24].
MQIA_HIGH_Q_DEP"TH [16]. (X'10'). *** 80% of 24 (MAXDEPTH)
Event message reference
Message descriptor (MQMD) in event messages :
the message type is MQMT_DATAGRAM,
and the message format is MQFMT_EVENT.
Message data in event messages -
the event message data is in programmable command format (PCF),
as is used in PCF command inquiries and res"ponses.
The event message consists of two parts: the event header and the event data.
Event header (MQCFH) -
the information in MQCFH specifies:
- The category of event.
Whether the event is a queue manager, performance, channel, configuration, command, or logger event.
- A reason code specifying the cause of the event.
For events caused by MQI calls,
this reason code is the same as the reason code for the MQI call.
MQCFH.Type := "Event" ;
MQCFH.Command := MQCMD_Q_MGR_EVENT | MQCMD_PERFM_EVENT | MQCMD_CHANNEL_EVENT | MQCMD_CONFIG_EVENT | MQCMD_COMMAND_EVENT | MQCMD_LOGGER_EVENT
MQCFH.Reason := MQRC_* ;
MQ v 6.0 Monitoring, chapter 7 [71/411].
#define MQRC_Q_FULL 2053
#define MQRC_Q_DEPTH_HIGH " 2224
#define MQRC_Q_DEPTH_LOW 2225
Let's make it run
\\MQ\Eines\EventMonitor> EvMo X1 SYSTEM.ADMIN.PERFM.EVENT
Argument (1) = (EvMo).
Argument (2) = (X1).
Argument (3) = (SYSTEM.ADMIN.PERFM.EVENT).
>>> MQ Connect to [X1].
+-+ MQ Connect CC [0], RC [0].
>>> MQ Open on object [SYSTEM.ADMIN.PERFM.EVENT] with options [x'2009'].
+-+ MQ Open CC [0], RC [0].
... wait for event message ... >
...get the event message ... >
Tue Apr 28 18:14:03 2009
Unknown Event message, [45].
CompCode(WARNING)
It's an unknown reason, [2224]. +++ MQRC_Q_DEPTH_HIGH
... wait for event message ... >
...get the event message ... >
Unk"nown Event message, [45].
CompCode(WARNING)
It's an unknown reason, [2053]. +++ MQRC_Q_FULL
Channel monitoring
To get channel events, use SYSTEM.ADMIN.CHANNEL.EVENT
To inquire channel status, use MQCMD_INQUIRE_CHANNEL_STATUS command - see amqsailq.c :
From amqsaicl.c :
mqAddString ( adminBag, MQCACH_CHANNEL_NAME, MQBL_NULL_TERMINATED, "*", &compCode, &reason); // set generic channel name
mqAddInteger ( adminBag, MQIACH_CHANNEL_TYPE, MQCHT_ALL, &compCode, &reason); // set channel type
mqAddInquiry ( adminBag, MQIACH_CHANNEL_TYPE, &compCode, &reason); // add Inquiry for various attributes
mqExecute ( hConn, MQCMD_INQUIRE_CHANNEL,
But we want to use "mqExecute ( hConn, MQCMD_INQUIRE_CHANNEL_STATUS" ...
Returned if
requested:
... BuffersReceived, BuffersSent, BytesReceived, BytesSent, ...
Maybe this sample helps - \\MQ\tools\pcf\samples\PCF_ChannelStatus.java
My code :
\\MQ\Eines\PCF_Inquiry_channel\ (pcf),
\\MQ\Eines\AMQSAILCH_display_channel_status\ (bags)
Also, the bytes using a channel is an interesting value to monitor, isn't it ?
display CHSTATUS(TO.SMQ) all
5 : display CHstatus(TO.SMQ) all
AMQ8417: Display Channel Status details.
CHANNEL(TO.SMQ) CHLTYPE(CLUSRCVR)
BATCHES(2) BATCHSZ(50)
BUFSRCVD(16) BUFSSENT(11)
BYTSRCVD(14180) BYTSSENT(516)
CHSTADA(2014-12-13) CHSTATI(19.58.15)
COMPHDR(NONE,NONE) COMPMSG(NONE,NONE)
COMPRATE(0,0) COMPTIME(0,0)
CONNAME(127.0.0.1) CURLUWID(398C8C5410000102)
CURMSGS(0) CURRENT
CURSEQNO(19) EXITTIME(0,0)
HBINT(300) INDOUBT(NO)
JOBNAME(00001C2400002360) LOCLADDR( )
LSTLUWID(398C8C5410000102) LSTMSGDA(2014-12-13)
LSTMSGTI(19.58.16) LSTSEQNO(19)
MCASTAT(RUNNING) MCAUSER(MUSR_MQADMIN)
MONCHL(OFF) MSGS(5)
NPMSPEED(FAST) RQMNAME(IB9QMGR)
SSLCERTI( ) SSLKEYDA( )
SSLKEYTI( ) SSLPEER( )
SSLRKEYS(0) STATUS(RUNNING)
STOPREQ(NO) SUBSTATE(RECEIVE)
XBATCHSZ(0,0) RVERSION(07050001)
RPRODUCT(MQMM)
Accounting and statistics
Statistics messages are delivered to the system queue SYSTEM.ADMIN.STATISTICS.QUEUE at configured intervals, defined by STATINT qmgr attribute
Queue statistics
information
is controlled by the queue attribute STATQ and the queue attribute manager STATQ.
Channel statistics
info
is controlled by the channel attribute STATCHL
There is a sample program in source format named amqsmon
that shows how to fetch and format the statistics messages {mq v6.0 monitoring, page 264, 286/411}
Read also
here
MQ v6 Monitoring, SC34-6593-00
Perque això funcioni ha d'estar activada una propietat de la cua
"supervisión de la cola" (MONQ) a la part de estadístiques.
Amb el valor "bajo" es suficient perque es poguin obtenir aquestes dades.
Segons l'ajuda del Eclipse els atributs on es poden mirar aquest temps son:
- Data i hora de l'últim missatge rebut: LPUTDATE y LPUTTIME
- Data i hora de l'últim missatge lliurat: LGETDATE y LGETTIME
Tot això l'he trobat a l'ajuda de l'Explorer de l'Eclipse.
runmqsc <qmgrname>
alter qlocal(M21B) MONQ(LOW)
6 : alter qlocal(M21B) MONQ(LOW)
AMQ8008: WebSphere MQ queue changed.
display qstatus(M21B) all
7 : display qstatus(M21B) all
AMQ8450: Display queue status details.
QUEUE(M21B) TYPE(QUEUE)
CURDEPTH(0) IPPROCS(1)
LGETDATE(2006-09-23) LGETTIME(19.50.10)
LPUTDATE(2006-09-23) LPUTTIME(19.50.10)
MONQ(LOW) MSGAGE(0)
OPPROCS(2) QTIME(0, 0)
UNCOM(NO)
SYSTEM.ADMIN.STATISTICS.QUEUE & AMQSMON
Start the statistics monitoring for queues, channels or both.
It creates you a report about all the messages /bytes/puts/gets...
that flows through a queue during the time period you plan in the statistics interval.
Reports are placed in the SYSTEM.ADMIN.STATISTICS.QUEUE.
You can extract the info with the amqsmon program: "amqsmon -m qmgr -t statistics > output.txt"
Collecting MQI statistics information
The collection of MQI statistics information is controlled by the queue manager attribute STATMQI.
Statistics messages are generated only for queues which are opened after statistics collection has been enabled.
For example, to enable MQI statistics use the following MQSC command:
ALTER QMGR STATMQI(ON)
Collecting queue statistics information
Queue statistics information collection can be enabled or disabled for individual queues, or for multiple queues.
To control individual queues, set the queue attribute STATQ.
Queue statistics information collection can be enabled or disabled at the queue manager level using the queue manager attribute STATQ.
To enable statistics information collection for the queue, Q1, use the following MQSC command:
ALTER QLOCAL(Q1) STATQ(ON)
To enable statistics information collection for all queues that specify the queue attribute STATQ as QMGR,
use the following MQSC command:
ALTER QMGR STATQ(ON)
Collecting channel statistics information
Channel statistics information collection can be enabled or disabled for individual channels, or for multiple channels,
using the attribute STATCHL.
For example, to enable statistics information collection, with a medium level of detail, for the sender channel QM1.TO.QM2,
use the following MQSC command:
ALTER CHANNEL(QM1.TO.QM2) CHLTYPE(SDR) STATCHL(MEDIUM)
To enable statistics information collection, at a medium level of detail,
for all channels that specify the channel attribute STATCHL as QMGR,
use the following MQSC command:
ALTER QMGR STATCHL(MEDIUM)
To enable statistics information collection, at a medium level of detail,
for all automatically defined cluster-sender channels,
use the following MQSC command:
ALTER QMGR STATACLS(MEDIUM)
Display formatted monitoring information
Use amqsmon to display the information contained within accounting and statistics messages in a formatted form.
Accounting messages are read from the accounting queue, SYSTEM.ADMIN.ACCOUNTING.QUEUE.
Statistics messages are read from the statistics queue, SYSTEM.ADMIN.STATISTICS.QUEUE.
v7 MQ Monitoring, chapter 4, statistics info collection
Performance evaluations
MP7I, des'2008 : W2003 & MQ v7 - xSeries 365, 4 CPU 3.0 GHz Intel Xeon, 4 GB of RAM
| Local queuing - 2K non-persistent messages
| 19.900 round trips / seg
|
| Local queuing - 2K non-persistent messages - NON trusted bindings (1)
| 15.700 round trips / seg
|
| Local queuing - 2K persistent messages
| 3.400 round trips / seg
|
| Client channels - 2K non-persistent messages
| 9.500 round trips / seg
|
| Client channels - 2K non-persistent messages - NON trusted bindings (1)
| 8.200 round trips / seg
|
| Client channels - 2K persistent messages
| 2.900 round trips / seg
|
| Server channels - 2K non-persistent messages
| 12.000 round trips / seg
|
| Server channels - 2K non-persistent messages - NON trusted bindings (1)
| 9.500 round trips / seg
|
| Server channels - 2K persistent messages
| 2.100 round trips / seg
|
(1) Responder program uses "shared" application bindings.
Requester program normally uses "trusted" bindings, except in the "non-trusted" scenario where it uses "shared" bindings.
SAG code measurements
Num msgs Size Pers Time
--------- ---- ---- ------
100.000 2 KB no 6 seg
200.000 2 KB no x seg
500.000 2 KB no x seg
1.000.000 2 KB no 80 seg
10.000 2 KB si 110 seg
50.000 2 KB si 512 seg
100.000 2 KB si 960 seg
200.000 2 KB si 2045 seg
Message monitoring
Message monitoring is the process of identifying
the route a message has taken through a queue manager network.
As a message passes through a queue manager network,
various processes perform activities on behalf of the message.
By identifying the types of activities,
and the sequence of activities performed on behalf of a message,
the message route can be determined.
The following techniques are available for determining a message route:
These techniques all generate special messages
that contain information about the activities performed on the message
as it passed through a queue manager network.
The information returned in these special messages
can be used to do the following:
- Record message activity.
- Determine the last known location of a message.
- Detect routing problems in your queue manager network.
- Assist in determining the causes of routing problems in your queue manager network.
- Confirm that your queue manager network is running correctly.
- Familiarize yourself with the running of your queue manager network.
url
Log d'instalació
If you used the lauchpad to install MQ,
check this file in your user Temp folder :
MQv6_Install_YYYY-MM-DDTHH-MM-SS.log
MO71, mqmonntp
Permite comprobar el ritmo al que se lee y se escribe en las colas, entre otras cosas.
MO71 has a web interface.
New homepage
MQGEM {need license key}
7.5.1 (free)
Old
support pack (gone),
v 6.0.1, Paul Clarke
API exercizer
See Chapter 13 :
You can start the API Exerciser from the main MO71 window, via the Action menu, or by pressing F9.
Gadgets
If your phone has a browser, it is now possible to use the HTTP support in supportpac MO71 to view your MQ queues, messages and more.
- install MO71
v 7.5.1
- start mqmonntp.exe
- File -> Add location & enter local qmgr name in both "location" and "qmgr" fields, then click "Add".
- right-click on qmgr name and select "queue list", then "refresh" to verify the access
- enable HTTP listener :
- File->Preferences & select the HTTP tab
- ensure that the "Root Path" field is set to the directory which contains the MO71 HTML files.
- set the TCP/IP port field to a suitable value as 80
- click the "Start" button to start the HTTP listener.
See message "Listener started", and mqmonntp_751.exe listening on port 80 {using TCPview}.
Is message is
TCP/IP function bind failed RC(10013)
means ... "permission denied" => Apache was running !
- enable our queue manager for HTTP admin :
- right click on the queue manager you wish to enable for HTTP admin and choose "Open Location"
- from the Location Settings window select the "Options" tab.
- ensure that the "HTTP allowed" and "HTTP Default" checkboxes are checked.
Scroll to botton to find and use "OK" button.
- to test the connection, enter the following URL in a browser of your choice on the mobile:
http://<hostname>/mq/admin/Queues/<qmgr name>
Fun with MQ and gadgets - browsing queues from my phone
URL = "localhost" displays "MO71 Web Administration main page" message
Can we browse MQ objects from a browser ?
Solutions :
- MS0B
- MO71, mqmonntp, with an interesting API Exercizer
- MQ bridge for HTTP
-
Visual Browse, USD 29.
MS0B = MQ Java classes for PCF
Use the WEB interface and put command messages to the command queue.
You need then something like MS0B support pack to interpret the result (or build the request).
MA0Y = MQ bridge for HTTP
Infocenter
Queue depth on Delphi GUI
Improve
\\Delphi\MQ\Monitor_Cua
to have a nice graphic output
Queue MSGIN / MSGOUT
If I use "mqmonntp" and, on a given qmgr (right click), select "queue statistics",
a window comes up with
- max depth
- msgs in
- msgs out
What command is being used to get those data ? "Queue Statistics" are used.
To start with, lets enable statistics on a given queue :
alter qlocal(QL.SEBAS) STATQ(ON)
2 : alter qlocal(QL.SEBAS) STATQ(ON)
AMQ8008: WebSphere MQ queue changed.
ALTER QMGR STATQ(ON)
3 : ALTER QMGR STATQ(ON)
AMQ8005: WebSphere MQ queue manager changed.
Statistics messages are generated at configured intervals (if there are changes in the counters).
The configured interval is controlled by the STATINT queue manager attribute.
STATINT specifies the interval, in seconds, between the generation of statistics messages.
The default statistics interval is 1800 seconds (30 minutes).
Sample (15 minutes = 900 seg) : "ALTER QMGR STATINT(900)"
To write the currently collected statistics data to the statistics queue
before the statistics collection interval is due to expire,
you can use issue the MQSC command RESET QMGR TYPE(STATISTICS).
This causes the collected statistics data to be written to the statistics queue and a new statistics data collection interval to begin.
Statistics messages are read from/written into the statistics queue, SYSTEM.ADMIN.STATISTICS.QUEUE
Statistics messages contents is very large, and the details can be found here :
"mq v6.0 Monitorig", page 297, 319/411.
Channel use on Delphi GUI
Code into
\\Delphi\MQ\Monitor_Channel
runmqsc command is
display chstatus(TO.SMQ3) all
4 : display chstatus(TO.SMQ3) all
AMQ8417: Display Channel Status details.
CHANNEL(TO.SMQ3) CHLTYPE(CLUSSDR)
BATCHES(0) BATCHSZ(50)
BUFSRCVD(47) BUFSSENT(47)
BYTSRCVD(1524) BYTSSENT(1524) // bytes sent/rcvd since channel was started
CHSTADA(2014-12-15) CHSTATI(13.16.45) // date and time when channel was started
How are those value reset ?
Never.
MQ Graphic Monitoring Tool
I want to have a dashboard that turns into a testing tool
Lluis diu que ho faria amb
node webkit
| simple Request/Response - Jonda, Reno

| client to Host - Teat, Jedas
| HA cluster - Indy, GNF

|
AMQ7257
If we launch the command "strmqm <qm-name>" and get this error
AMQ7257: The MQ service must be running to perform the requested operation.
url
We have to verify that the service shall start with the user ".\MUSR_MQADMIN"
Then we display all MQ services :
c:\> sc query state= all | find "MQ"
SERVICE_NAME: MQSeriesBrokerBK_CNT
SERVICE_NAME: MQSeriesBrokerIB9NODE
SERVICE_NAME: MQSeriesServices
DISPLAY_NAME: IBM MQSeries
SERVICE_NAME: MQ_Installation1
DISPLAY_NAME: IBM WebSphere MQ (Installation1)
Then we display its status
c:\> sc query "MQ_Installation1"
SERVICE_NAME: MQ_Installation1
TYPE : 10 WIN32_OWN_PROCESS
STATE : 1 STOPPED
WIN32_EXIT_CODE : 1077 (0x435)
SERVICE_EXIT_CODE : 0 (0x0)
CHECKPOINT : 0x0
WAIT_HINT : 0x0
We display all details :
c:\> sc qc "MQ_Installation1"
[SC] QueryServiceConfig SUCCESS
SERVICE_NAME: MQ_Installation1
TYPE : 10 WIN32_OWN_PROCESS
START_TYPE : 3 DEMAND_START
ERROR_CONTROL : 0 IGNORE
BINARY_PATH_NAME : C:\MQ\Bin\amqsvc.exe
LOAD_ORDER_GROUP :
TAG : 0
DISPLAY_NAME : IBM WebSphere MQ (Installation1)
DEPENDENCIES :
SERVICE_START_NAME : .\MUSR_MQADMIN
So we can start the service :
c:\> sc start MQ_Installation1
SERVICE_NAME: MQ_Installation1
TYPE : 10 WIN32_OWN_PROCESS
STATE : 2 START_PENDING
(STOPPABLE, NOT_PAUSABLE, ACCEPTS_SHUTDOWN)
WIN32_EXIT_CODE : 0 (0x0)
SERVICE_EXIT_CODE : 0 (0x0)
CHECKPOINT : 0x0
WAIT_HINT : 0x7530
PID : 3240
FLAGS :
Then we can
c:\>dspmq
QMNAME(QM_CNT) STATUS(Ha finalizado inmediatamente)
QMNAME(QM_CNT2) STATUS(Ha finalizado de manera inesperada)
QMNAME(IB9QMGR) STATUS(Ha finalizado de manera inesperada)
c:\> strmqm QM_CNT
OS/400
Aixo és un altre
mon ... que parla EBCDIC !
Application activity trace information collection
Since
MQ v7.1, an "application activity" trace can be started,
that writes into SYSTEM.ADMIN.TRACE.ACTIVITY.QUEUE, that later we format using a Support Pack
MS0P.
Activity records are written to the new system queue SYSTEM.ADMIN.TRACE.ACTIVITY.QUEUE.
They collect information about the MQI operations that an application performs while connected to a queue manager.
To control whether or not application activity trace information is collected, you configure one or more of the following settings:
- The ACTVTRC queue manager attribute - "ALTER QMGR ACTVTRC(ON)" or "Qmgr properties + Online Monitoring + Activity Trace"
- The ACTVCONO settings (in the MQCNO structure passed in MQCONNX)
- The matching stanza for the application in the activity trace configuration file mqat.ini
Admin / troubleshooting exercices
- stop the queue manager - kill "amqxssvn.exe" or "amqzxma0.exe".
- stop/kill the listener - kill "runmqlsr.exe" or "endmqlsr" : amqsputc still gets rc=0 !?
- stop the command server - kill "amqpcsea.exe" or "endmqcsv".
- stop the channel initiator - kill "runmqchi.exe".
- stop the trigger monitor - kill "runmqtrm.exe".
- stop the sender channel (as there is no trigger monitor, messages shall stack on xmit q)
- stop the receiver channel - kill "amqrmppa.exe".
- set data queue to put(disabled) - no, obtenim MQRC 2051, MQRC_PUT_INHIBITED
- set DLQ to put(disabled)
- fill the data queue (decrease max depth)
- fill DLQ
- fill DLQ and send a Persistent message using a channel (it gets stopped)
- fill FileSystem, so AMQERR01.LOG can not grow !
- change AMQERR01.LOG owner to "sebas" : 1x FDC per
minut !
- set general/specific AMQERR01.LOG owner to "root" (chown)
- rename MQS.INI
- rename \qmgr_name\QM.INI
- set S0000000.LOG (active log) to "read-only"
- RFE (request for enhancement) num.
22533 - to disable the "REFRESH CLUSTER" with "REPOS(YES)" on full repositories.
This option must not be used on full repositories but is still valid and causes a cluster to become corrupted.
- delete "jdbcora10.dll" from "\\MQ\exits\" but code "XAResourceManager:" (SwitchFile=jdbcora) in qm.ini
- (aix) set "hostname" with white spaces in it + create queue manager
Environment :
. | .
. QM1 | QM2 .
. | .
. QR1 QM2 QM1.QM2 QL2 QT2 .
. - - - - ---------- - - - - .
. | | | | -> O ) | | | | .
. -- -- ---------- -- -- .
. [AMQSREQ] | .
. QL1 QM2.QM1 QM1 [AMQSECHA] .
. - - ---------- - - .
. | | ( O <- | | .
. -- ---------- -- .
. | .
. [DLQ] | [DLQ] .
Config & run :
QM1 :
DEFINE QL(DLQ) DEFPSIST(YES) MAXDEPTH(5000) MAXMSGL(104857600) replace * we always want a dead letter queue
ALTER QMGR DEADQ(DLQ) * make sure qmgr uses this one
DEFINE QL(QM2) USAGE(XMITQ) TRIGGER INITQ(SYSTEM.CHANNEL.INITQ) TRIGDATA(QM1.QM2) * transmit queue
DEFINE QL(QL1) * answer queue
DEFINE QR(QR1) RQMNAME(QM2) RNAME(QL2) XMITQ(QM2) * remote queue
QM2 :
DEFINE QL(DLQ) DEFPSIST(YES) MAXDEPTH(5000) MAXMSGL(104857600) replace * we always want a dead letter queue
ALTER QMGR DEADQ(DLQ) * make sure qmgr uses this one
DEFINE QL(QM1) USAGE(XMITQ) TRIGGER INITQ(SYSTEM.CHANNEL.INITQ) TRIGDATA(QM2.QM1) * transmit queue
DEFINE QL(QL2) TRIGGER INITQ(QT2) PROCESS(RSP) * request recevive queue
DEFINE QL(QT2) * trigger message init queue
DEFINE PROCESS(RSP) APPLICID('AMQSECH.EXE') * process to start answering program
DOS :
start RUNMQTRM -m QM2 -q QT2 * trigger monitor
AMQSREQ.EXE QR1 QM1 QL1 QL1 QM1 * send request and display response
Upgrading trial version
It is possible to upgrade your trial setup to the full product,
without needing to reinstall WMQ or recreate their queue managers.
When you normally install the full product,
the installer registers your new "production" license as a part of the installation process.
But it is possible to manually register the license that you get when pay for the full product.
License files are named amqXcert.lic, (c:\mq\bin) where X identifies the license type:
- amqtcert.lic - trial license
- amqbcert.lic - beta license
- amqpcert.lic - full production license
The command to do this is setmqprd (enroll production license)
and is documented in the System Administration Guide.
setmqprd installs the license,
as well as carrying out a number of checks to confirm that it has been correctly applied.
url
MQ people
- MQ Admins
- MQ Developers/programmers
- MQ Testers
- MQ Support
Each group above have different needs, hence, require different information from their MQ tools.
- MQ Admins deal with MQ objects and their attributes & monitoring of their MQ environment
- MQ Developers are concerned with message data/payload (sometimes about queue attributes)
- MQ Testers are concerned about plug-and-play message "sets" or message cycles
- MQ Support people need MQ tools to resolve 2AM problems which could be queue attribute issue or message data issue
You need to clearly define who your MQ tool is for, then build the best MQ tool for that particular customer base.
Links
-
Business Integration Server Express
overview
-
MQ v 6 Monitoring
-
T. Rob's
Good practices of Websphere MQ production deployment
-
how migration, failover, and the scaling of queue managers are affected in a
SOA context
-
Cacti
-
use
Power Shell
-
MS0P = MQ Explorer - Configuration and Display Extension Plug-ins
Windows :
MO70 = display channel statistics
o
MS0P = MQ Events and Statistics Plug-in.
A tool written by Mark Taylor at the Hursley Lab, that integrates with the MQ Explorer.
It provides several useful features to generate reports from MQ Statistics as well as monitoring Queues and Channels.
It also includes a neat Queue Tuning Tool to adjust the Queue Buffers to improve performance.
{Honda Bhyat}
Start PerfMon and add MQ Queue object and its counters.
- commercial tools
MQ Monitoring and Tools (see MQSERIES.NET fora) :
Nastel,
BMC's BMM-PA (formerly known as QPasa),
QFlex :
url,
Wili, Avada Infrared360, (Candle) Tivoli, Patrol, OmegaMon, Autopilot, ISAlite,
amqsailq,
amqsmon -> CSV -> Excel,
MH-04,
MQMON tool,
MQ PCF commands,
etc.
Que son : QNAMI, Transaction Vision, Cressida ?
QNAMI = monitoring and management solution.
Real-time, end-to-end visibility of the state of business services within the business process.
Bristol Technology
Transaction Vision
qView
IBM :
Agente Tívoli OmegaMon XE for Business Integration
Ged.s uses Tivoli OmegaMon.
Allia.z uses
Cacti.
C.rreus uses "BMC Patrol"
En Xtreme Leverage se tiene que bajar el Tivoli Monitoring v6.1
y después el Omegamon XE for Messaging (ver MQ versus MB)
Capitalware list of tools :
free,
commercial.
Veure que es "Autopilot TM", monitor de transaccions sobre MQ -
http://www.tsg.co.uk/ :
with Autopilot TM, you can track each transaction in your MQ network
Long awaited free enterprise strength MQ monitoring solution is finally here.
Netflexity, an IT products and services company from Philadelphia, PA,
announced that it will release its version of Qflex at no cost.
Qflex sports an impressive array of features.
It is 100% J2EE compliant web application
with comprehensive MQ monitoring and performance tracking capabilities.
Web based message browser is a bonus feature.
Downloads and more product details are available at
www.netflexity.com/QFlex.shtml
2011/12 :
http://www.netflexity.com/qflex/index.shtml.
Qflex 2.0.0.0 (19 MB)
Any questions regarding the product
can be posted under Monitoring Tools forum.
Eina comercial :
Patrol for MQ :
PATROL for MQ provides true end-to-end availability
and is unmatched in its depth of capabilities,
which include configuration, performance monitoring,
operations management, content management, optimization,
recovery and automation.
PATROL for MQ is easy to use
and offers packaged "out-of-the-box" solutions
that can be custom-tailored.
It is the most flexible management solution available,
easily integrating into a customer's existing IT environment
and providing fast implementation and ROI.
-
MQjExplorer {java},
{sag}
-
MO71 =
mqmonntp.exe -
provides a simple, easy to configure GUI interface to administer WebSphere MQ (MQSeries) Queue Managers,
by paulg_clarke@uk.ibm.com
-
MQ
VE -
Visual Edit v1.6.1 application allows users to view, manipulate and manage messages
in a queue of a WebSphere MQ (formally MQSeries) queue manager
and presents the data in a simplified format similar to a database utility or spreadsheet program.
-
a web-based monitoring tool for WebSphere MQ.
Download 0.2.1,
{\\mq_tools\mega.com 2014-10-22}
Install on Apache Tomcat:
- Deploy WMQ Monitoring
Copy wmq-monitoring.war to apache-tomcat-xxx/webapps directory.
- Start and stop server
- cd apache-tomcat-xxx/webapps/bin
- shutdown (stop the server)
- startup (start the server)
- once the server is started, try to access http://localhost:8080/wmq-monitoring
with latest Google chrome browser (user/password: mqadmin/mqadmin).
-
MQGEM has
- MO71 = GUI admin and cfg tool
- MQSCX = RUNMQSC/MO72 on steroids

