|
Plotting
and analyzing a football match with all players’ positions.
You can
plot and analyze the positions of a complete team on a field with the
following
tools:
a)
the
file excel containing the Latitude and Longitude of any player
b)
the
utility “Excel to Google Earth” that you find on the website Earth
Point (www.earthpoint.us): it is free for educational purpose, you can write to
Bill Clark,
clicking on “contact”, he will be glad to give you a 1-year access for
free if
you specify the name of your school, the free access will be renewed
any year
for free. Anyway for a limited number of values the use is free in
anyway.
Since we need at most 11 positions at a time, it will work no matter if
you ask
the free access or not.
c)
The
program Google Earth
Instruction:
You produce
an excel file with at least 2 columns, 1 for Latitude, one for
longitude. For
instance you list the 11 position of latitude and longitude of all the
players
at some time.
At the top
of these columns you have got to have a cell containing the exact words
“Latitude”, and “Longitude”.
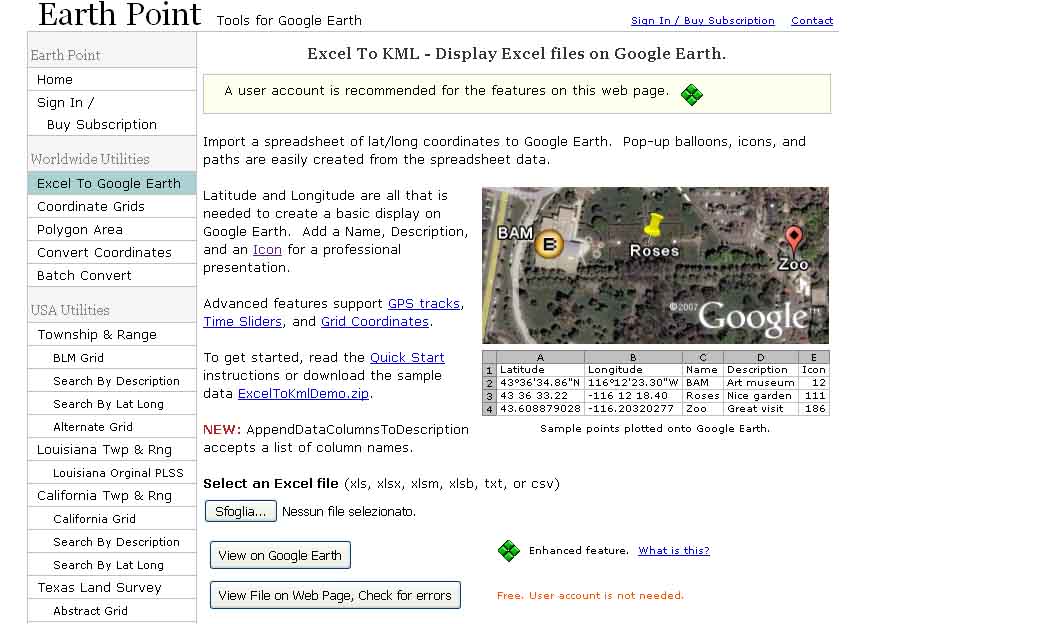
On www.earthpoint.us you select “Excel to Google Earth”, select your
Excel file, and click
on “View on Google Earth”. You will the players’ positions plotted on
the
location they were playing football, on Google Earth.
The “View
on Google Earth can produce also a KML file you can use for any
purpose: In the
"Places" window of Google Earth, right-click the folder "Earth
Point Excel To KML", and from the pop-up menu, select "Save As".
You will find the file in the directory you specify.
Google
Earth Icon: If you include in your Excel file a column starting with
the word
“Icon”, and in the second cell below you write the reference number of
the
icons offered by “Earthpoint” website, you can even have in Google
Earth plot
the football player icon!
Further
developments:
a)
Match
evolution: you can put a number of these files one after the other,
watch it
like a film, and analyze how the team in its entireness moved and
behaved
during a time period of the match.
b)
Area
covered by a team: after producing the Google Earth vision of the
team’s
positions, you choose the utility “Polygon Area”, also available as the
previous one. Following the easy instructions you can calculate the
area
enclosed by the players’ positions, to understand if they were playing
as a
scattered or a curled up team.
Included
some examples hereafter: