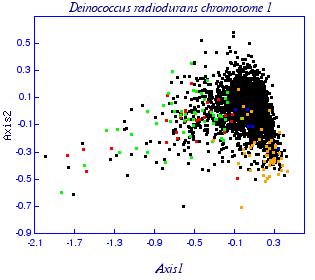
Correspondence analysis of relative synonymous codon usage for Deinococcus radiodurans chromosome 1 genes:
 |
|
|||||||||||||||||||||||||||
| ||||||||||||||||||||||||||||
Correlation values between main axis in correspondence analysis and different parameters. See the Abbreviations used:
|
||||||||||||||||||||||||||||
Correspondence analysis of relative synonymous codon usage for Deinococcus radiodurans chromosome 1 genes:
|
|
|||||||||||||||||||||||||||
| ||||||||||||||||||||||||||||
Correlation values between main axis in correspondence analysis and different parameters. See the Abbreviations used:
|
||||||||||||||||||||||||||||